Create Excel (XLSX) reports with data from Salesforce. Datadumps or complex groupings … We got you covered.
Example: Above video explains same example. Let’s say, you need to create an Excel report of Salesforce Opportunities. Follow below steps to achieve this.
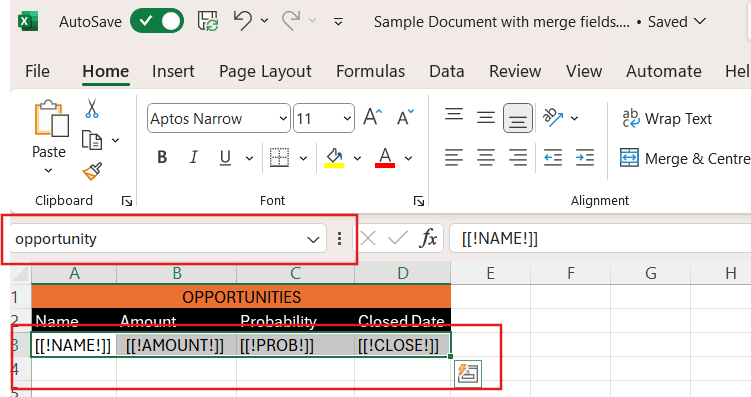
- Create an Excel file with merge fields. Here is the sample excel file you can download and make use of it.
Few things that needs to be considered while creating excel file are
– After adding merge fields, select the entire row of merge fields and give a name(Let’s say “opportunity”) in the Name box and press enter. Then save the excel file. As PDF Butler need to know which region in the excel should be repeated, this has to be done.

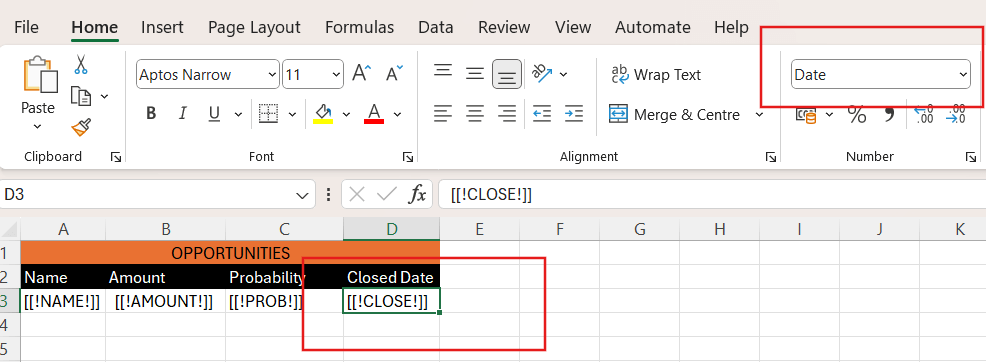
– You can format the column data according to the data type of the merge field. Let’s say, you have a Date column and wanted to format as short date in the final report. You can do this in excel file by selecting that Date merge field and choosing Short Date in the number format section.

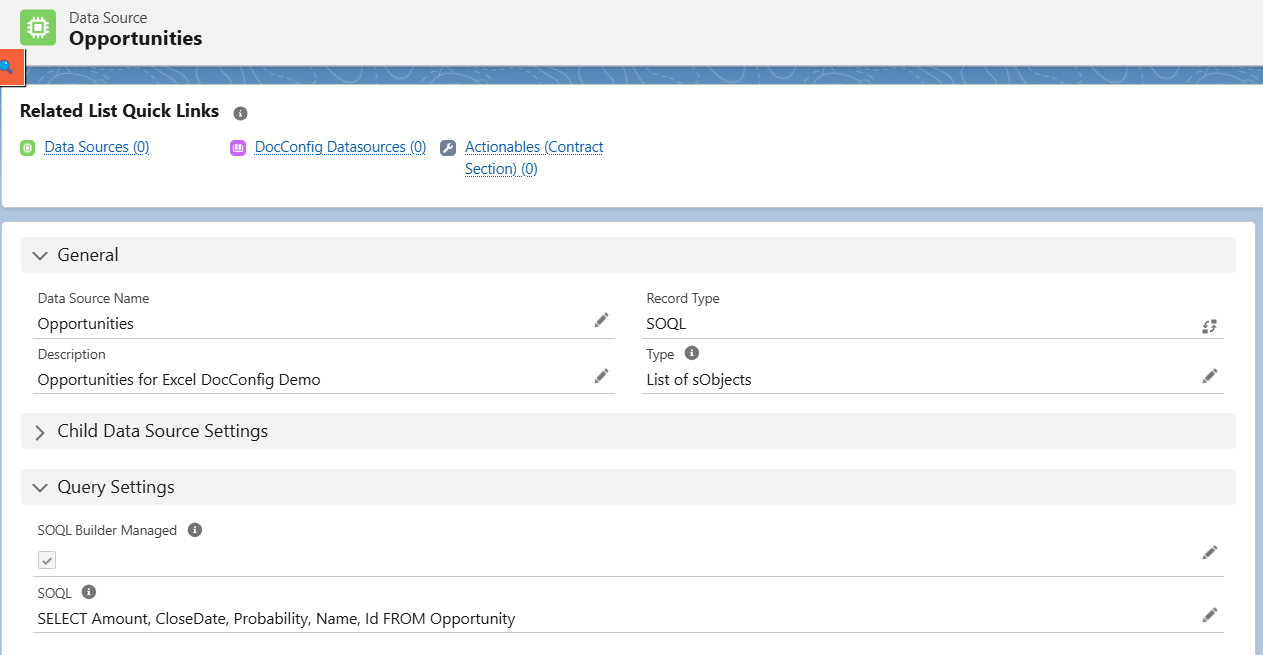
- Create SOQL Data Source to fetch opportunity records as below.

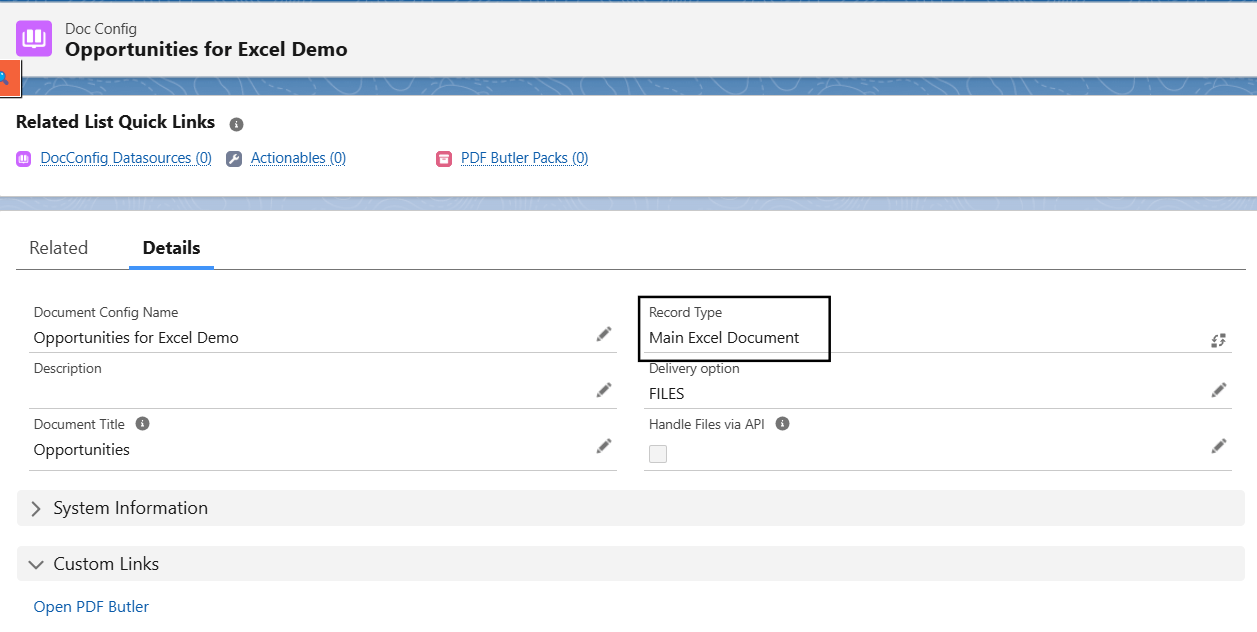
- Create Doc Config of Main Excel Document type as shown below.

- Open PDF Builder from the Doc Config and add the Data Source.
- Upload the Sample excel file with merge fields in PDF Builder in Doc Config Documents sections.
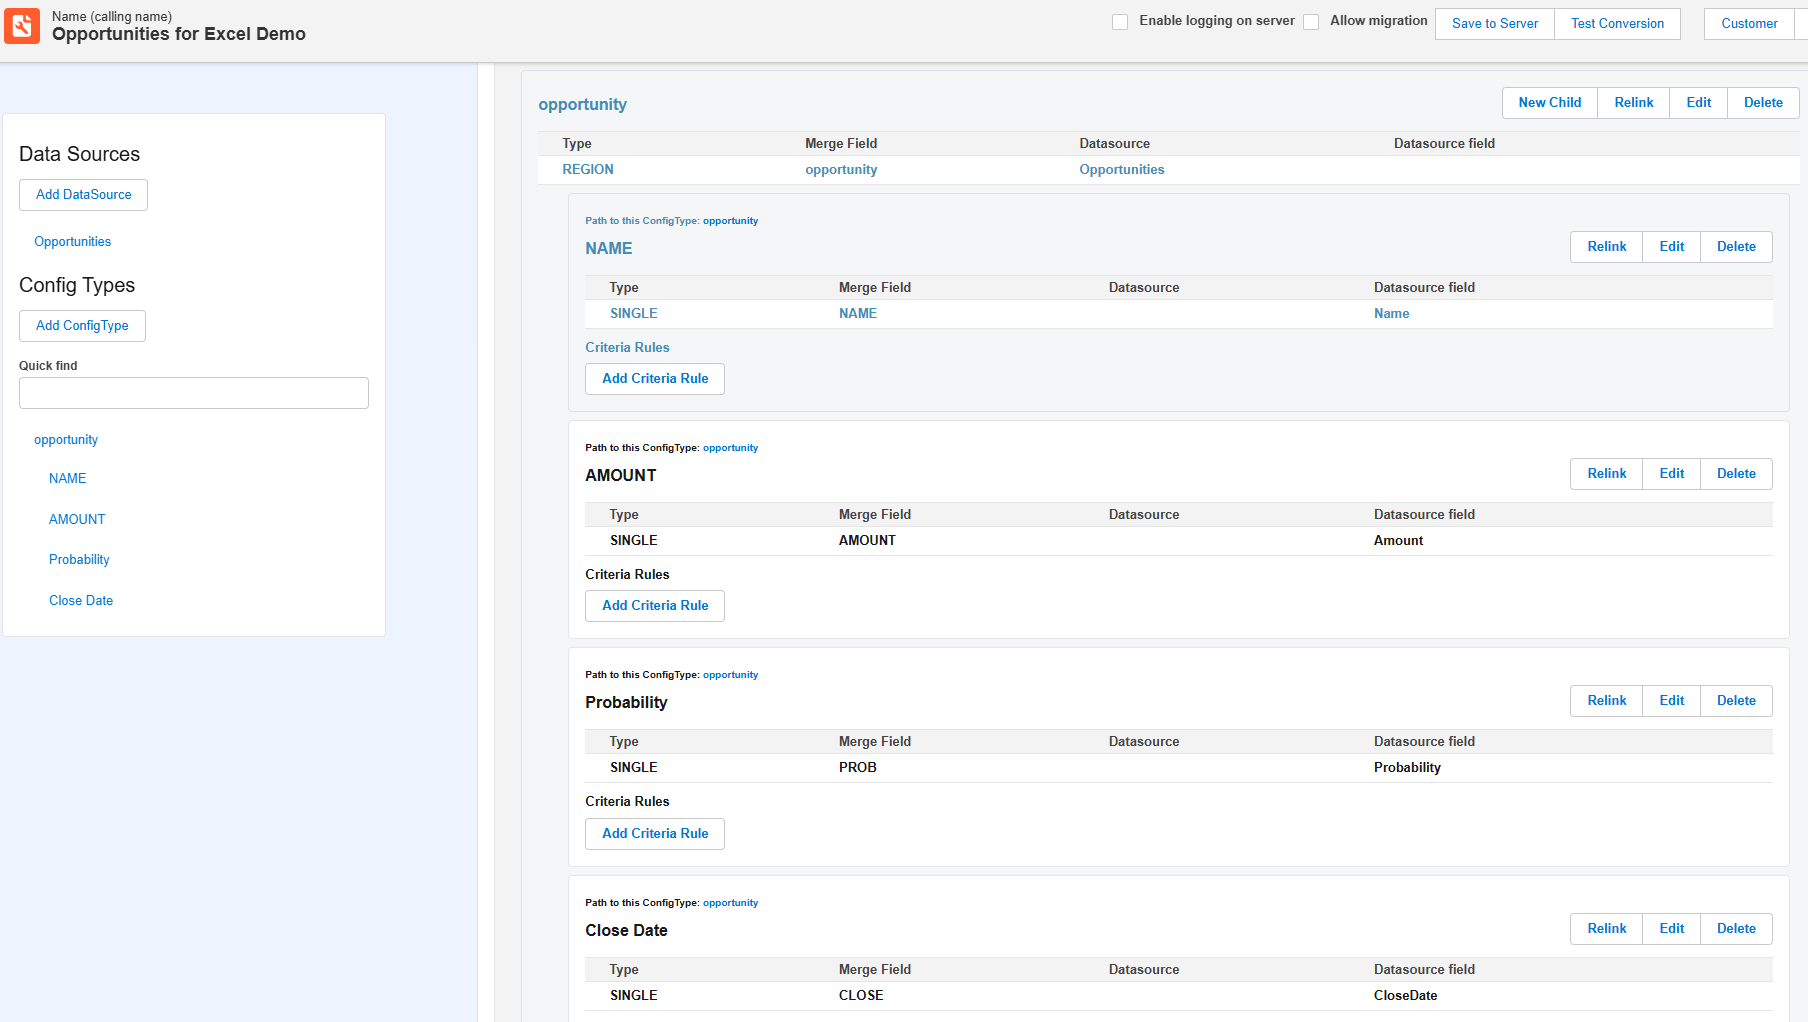
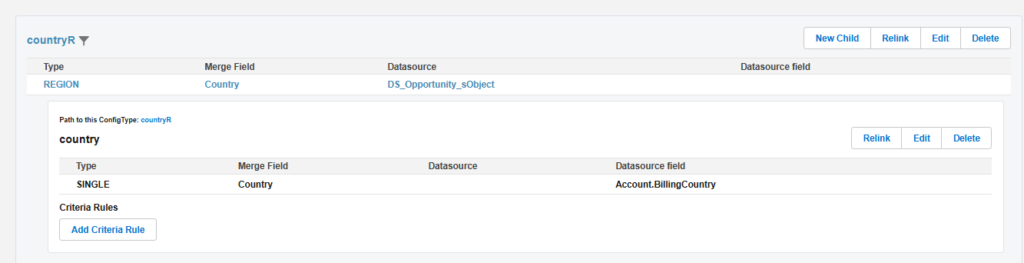
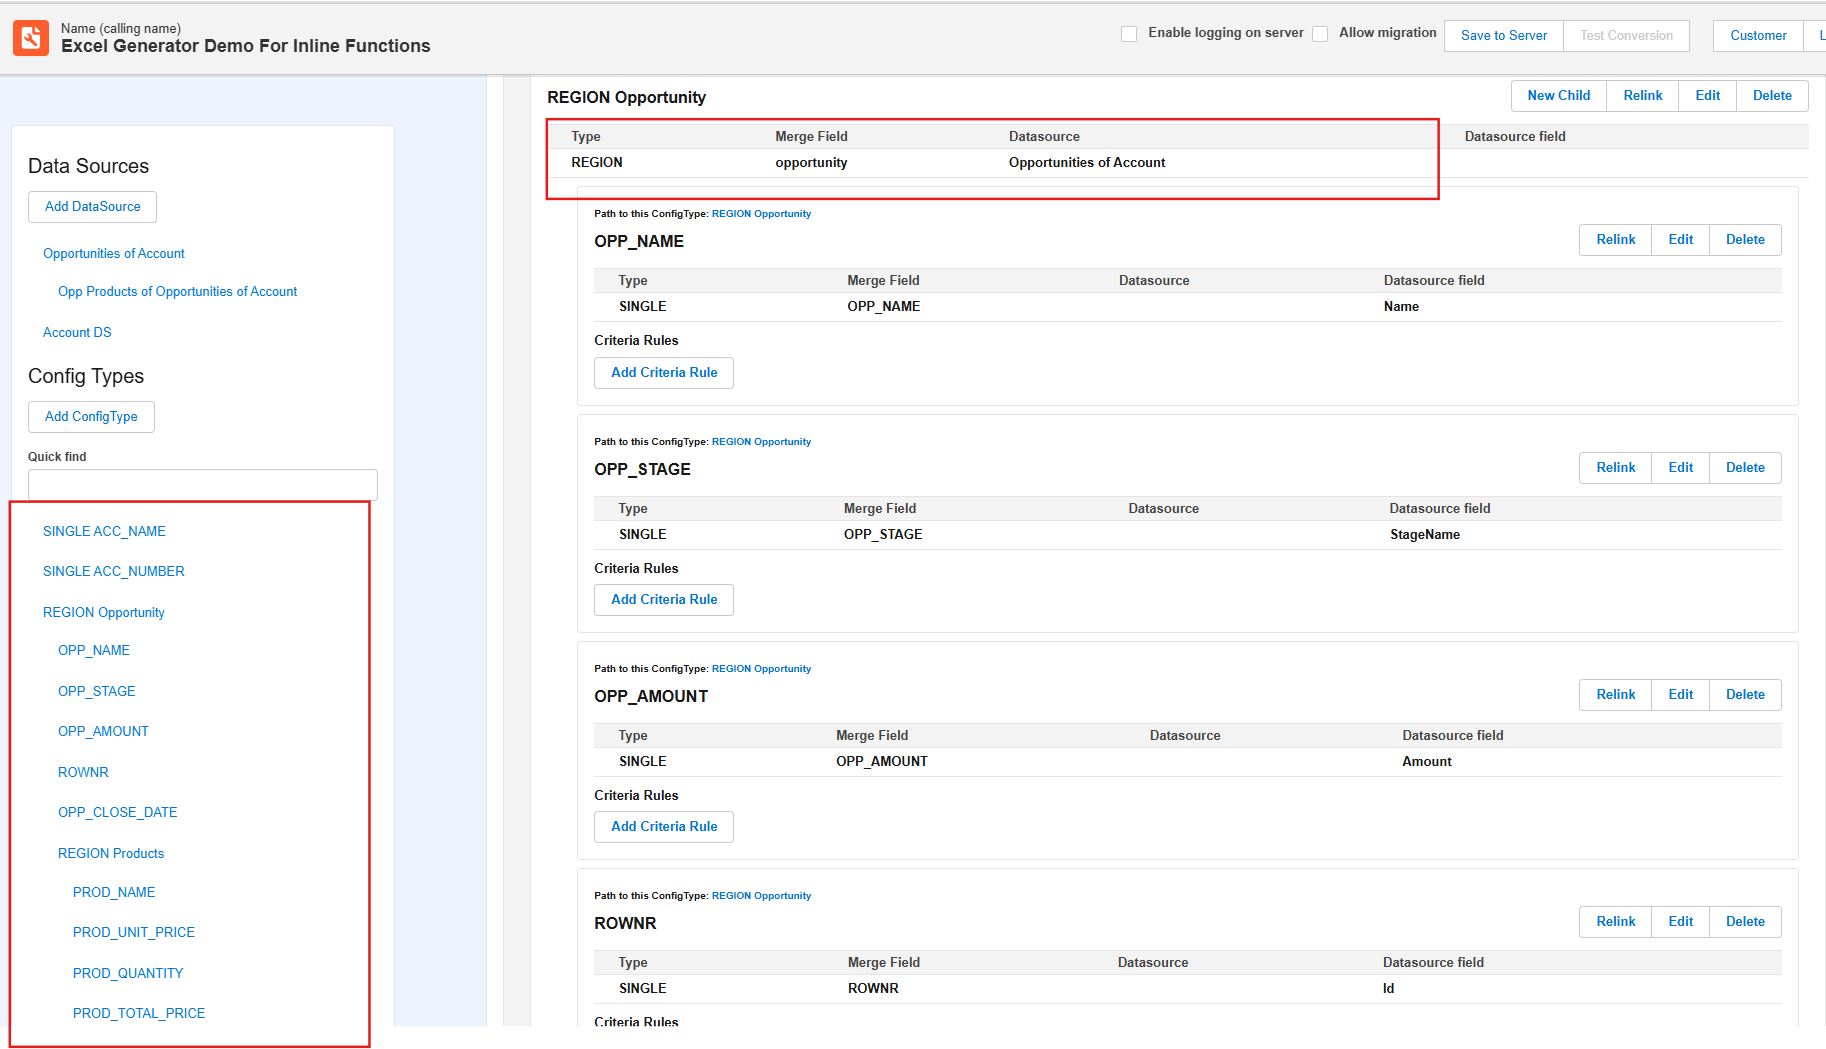
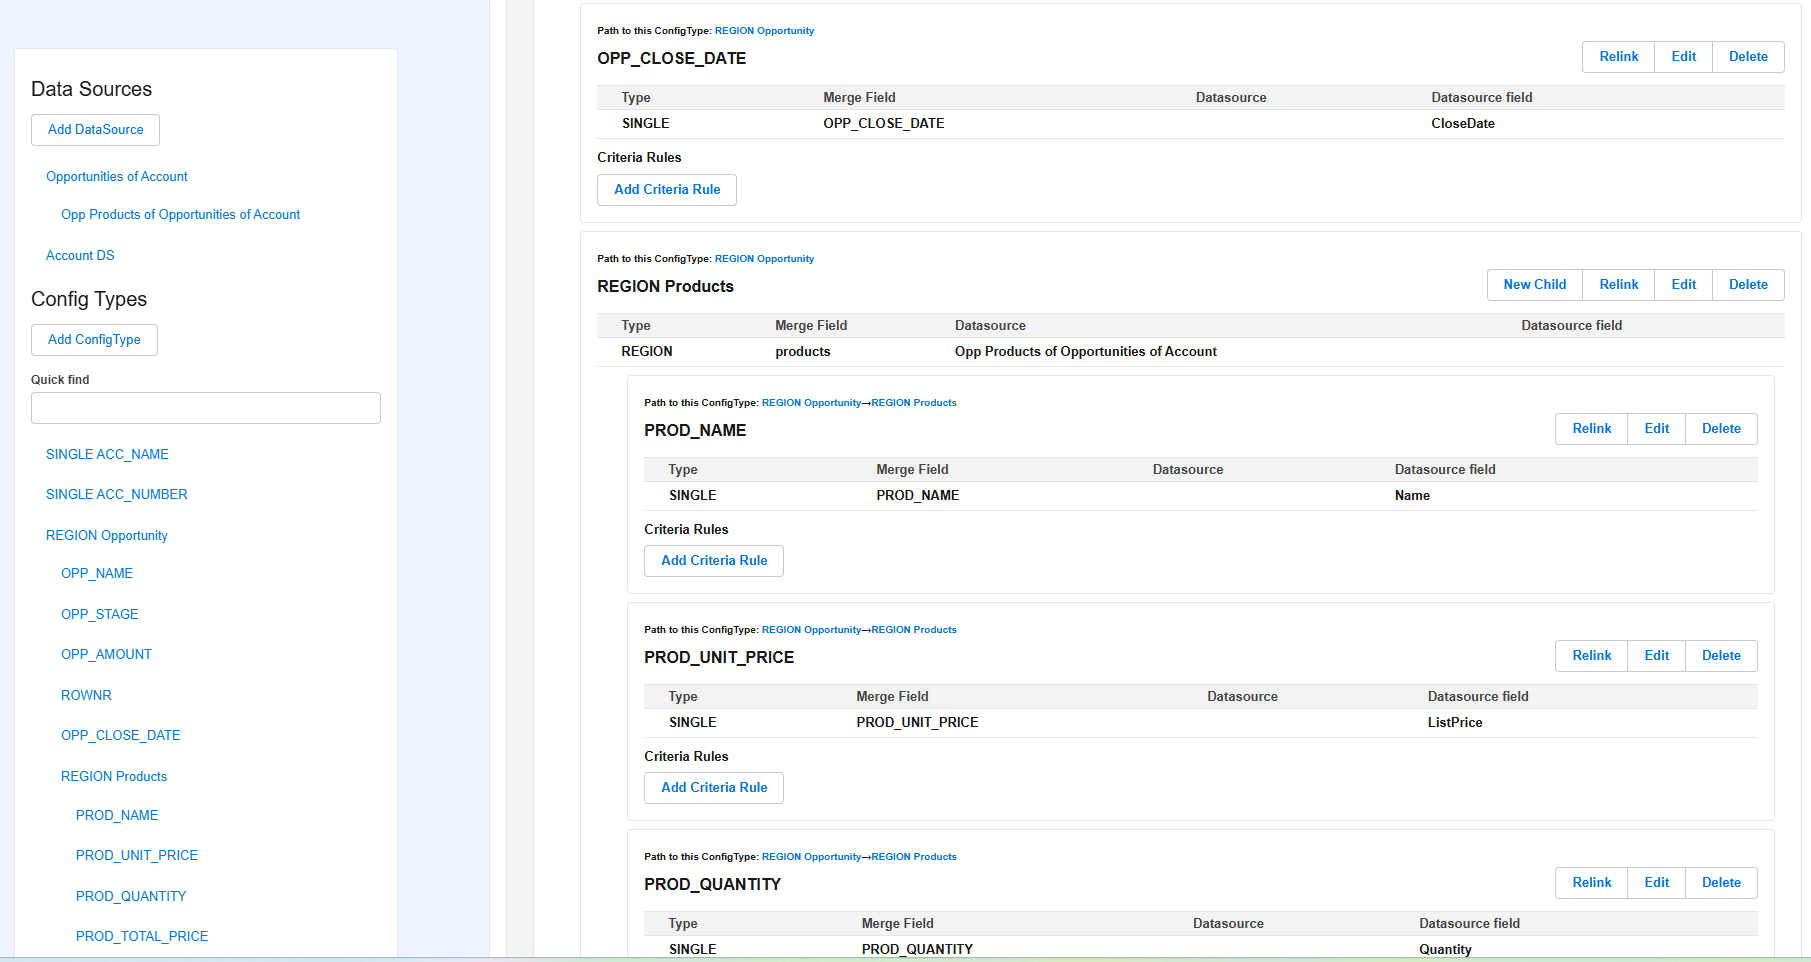
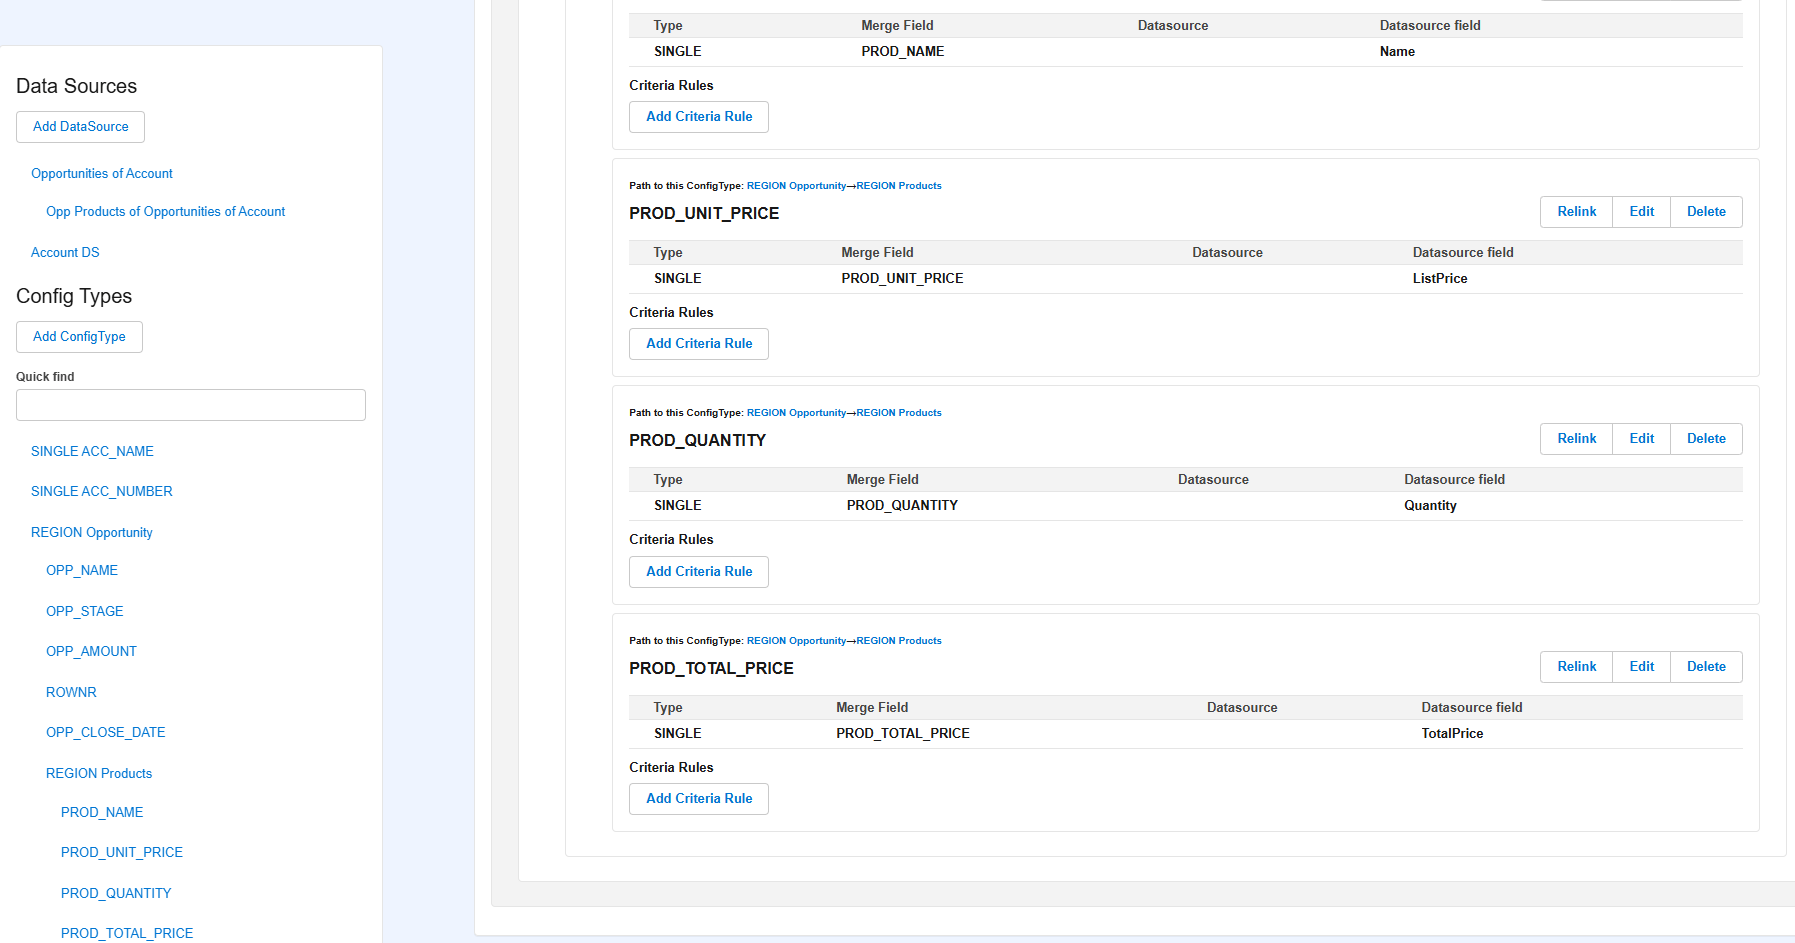
- Create Region Configtype for the repeating row(opportunity) which you have mentioned in the excel file.
- Create Configtype for each merge field in the excel file as a child for Region configtype.

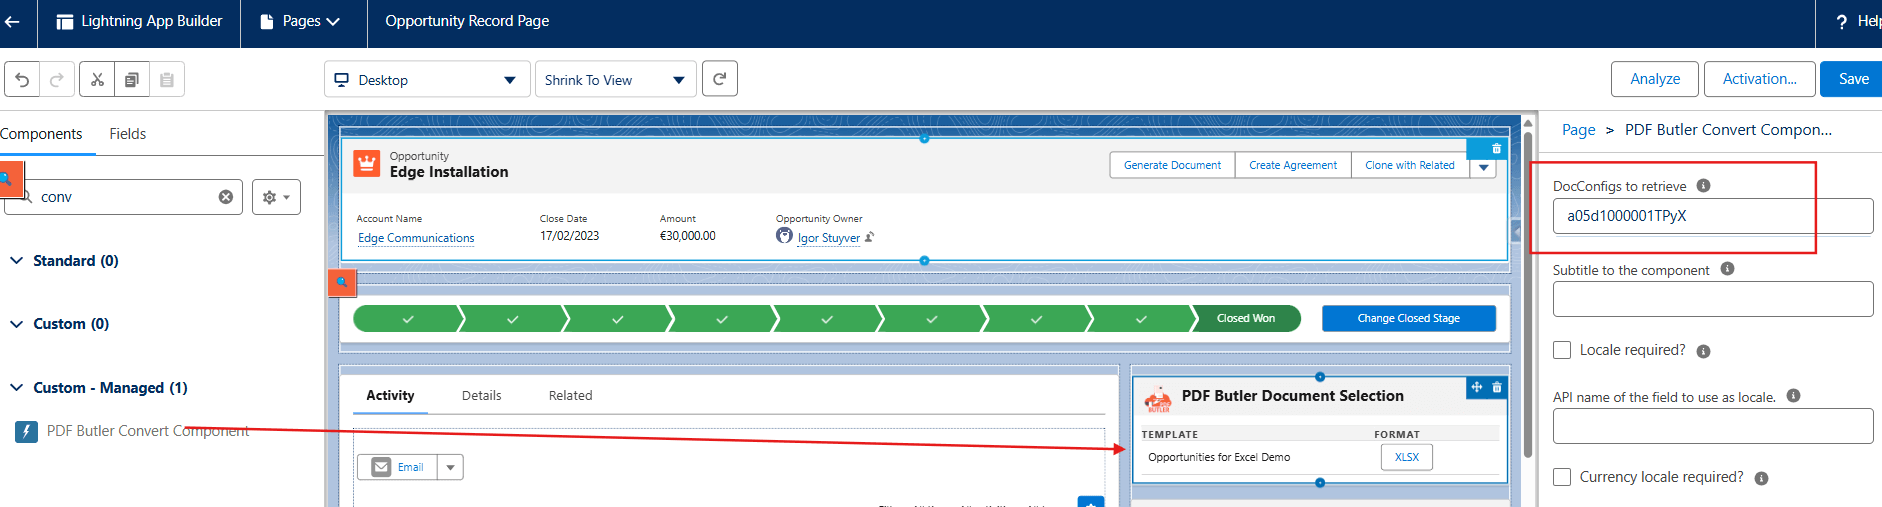
- Edit opportunity page to add the Excel DocConfig id.

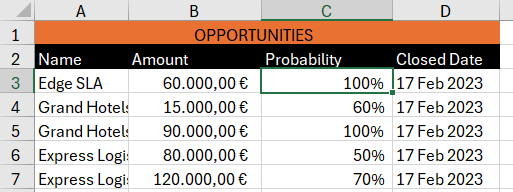
- Go to any opportunity and download the report. The report will fetch the opportunities from salesforce and displays all the information according to the format you have given in your doc config document excel file.

Support Criteria Based on a Field in a Single Data Source (Excel Regions) #
You can now control the visibility of an Excel Region using Criteria based on a field coming from a Single Data Source.
With this capability, admins can dynamically show or hide Regions in Excel output files based on values coming from a Single Data Source, enabling more flexible document generation logic.
This enhancement is especially useful when a Region must appear only when a specific field in the Single Data Source contains a value, meets a condition, or is empty.
When to Use This Feature
Use Criteria with a Single Data Source when:
-
Your Excel template contains a Region populated from a Single Data Source.
-
You want to show/hide the entire Region depending on a field value.
-
Your business logic requires conditional visibility without involving repeating rows or LIST data.
Configuration Steps
1. Assign a Single Data Source to the Region
In your Excel ConfigType, select your Region and assign a Single Data Source.
2. Open the Criteria Builder
Inside the Region configuration:
-
Click Add Condition (or Add Group)
-
Select the field from the assigned Single Data Source
-
Define the criteria (Equals, Not Empty, Contains, etc.)
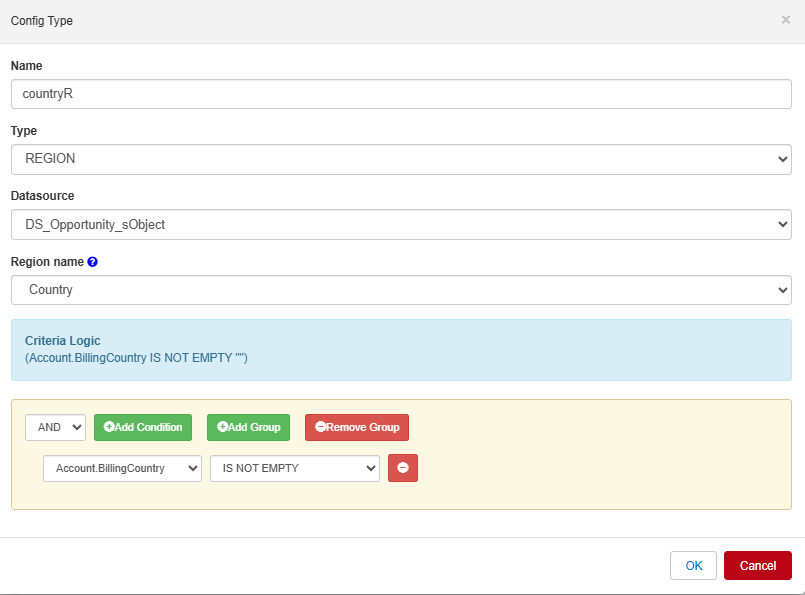
3. Define Show/Hide Behavior
A Region will:
-
Be shown when the criteria evaluate to true
-
Be fully hidden when the criteria evaluate to false
There is no partial rendering: the entire Region is removed from the final Excel document.
Notes
-
Criteria for Single Data Sources work exactly like criteria for LIST Data Sources, but apply to a single record only.
-
A Region with no criteria behaves normally (always visible).
-
If criteria groups are used, they follow AND/OR logic as configured in the builder.
⚠ Important Note About Data Placed in the Same Row as the Region
If you add any static text, formulas, or other Excel content in the same row where the Region is placed – but outside the Region boundaries, this content will also be hidden when the Region is hidden by criteria.
Because the entire row is removed when a Region is not rendered, any data on that row (even if not part of the Region) will not appear in the generated Excel file.
Recommendation:
Place unrelated content above or below the Region’s row(s) to ensure it always remains visible, regardless of criteria.
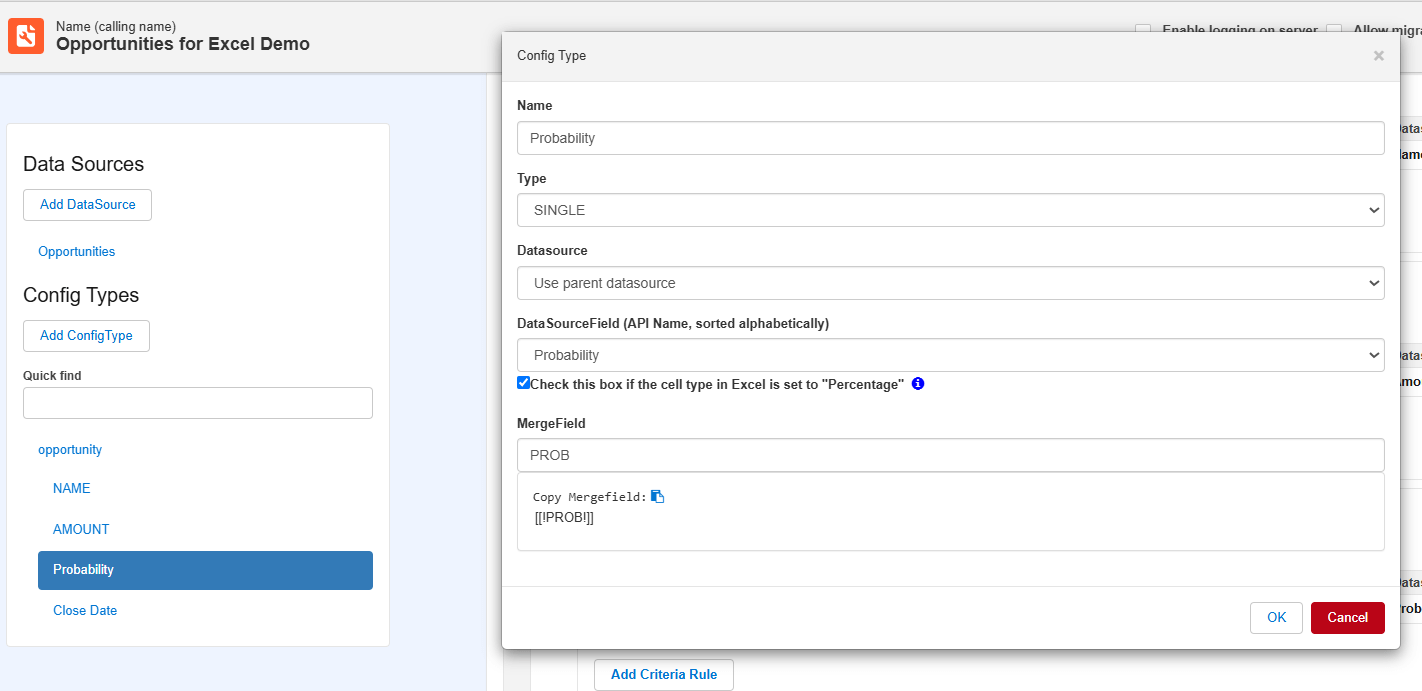
PERCENT field #
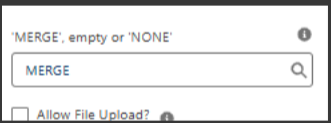
Need to handle a Salesforce PERCENT field in Excel? Salesforce does not store Percent fields with decimals eg it will store 75% as 75. While Excel expects 0.75 to show 75% for a Percentage field. To achieve this, check the option C
In the above example, probability is a percent field and you have to check the above option if you formatted the merge field as percent in the excel file as shown below.
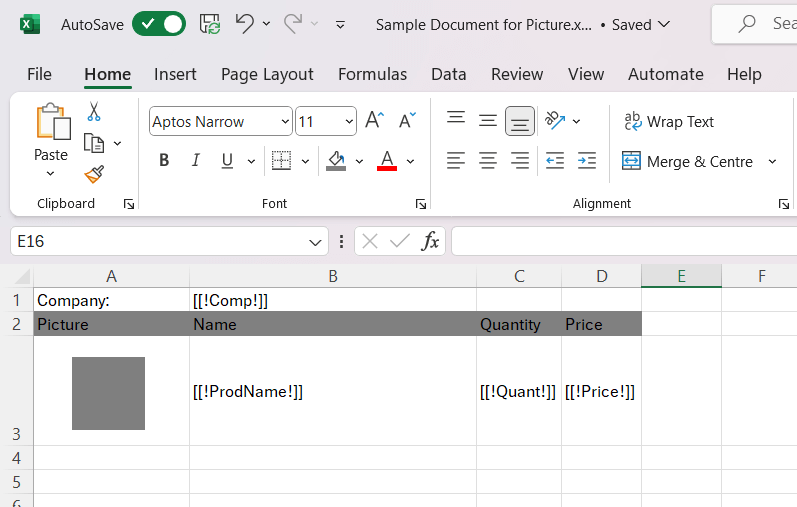
Images #
Repeat images for each region you replicate in the Excel. Perhaps you want to show a thumbnail of a product in a list.
For more information on the PICTURE DataSource: PICTURE DataSource – PDF Butler
Example: Above Demo explains same example. Let’s say you want a report of opportunity products with image of each product in the row. You already understood how to create an excel file with merge fields in the beginning of this topic. Insert the picture placeholder in picture cell and add merge field to the picture placeholder. You can download the placeholder here.
Follow below steps.
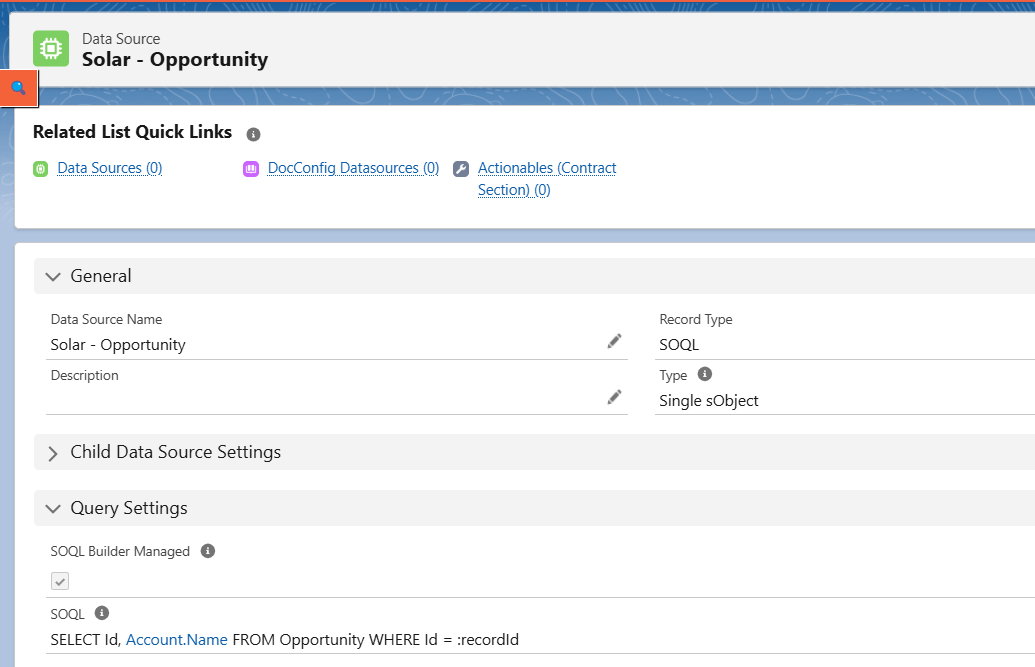
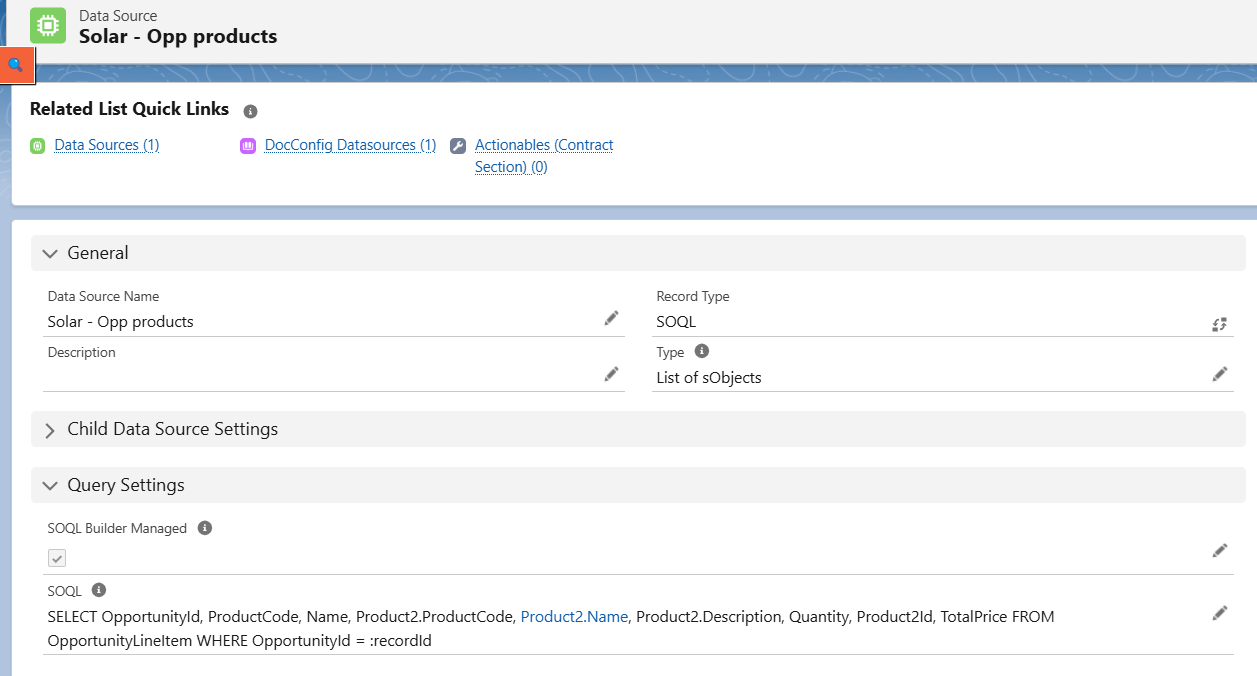
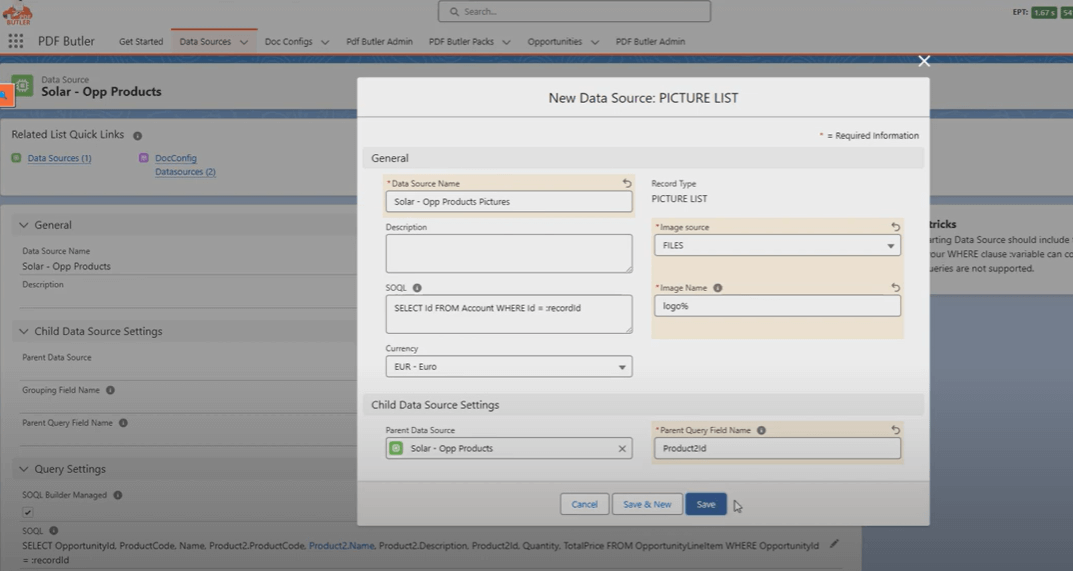
- Create SOQL Data Sources to fetch the opportunity and opportunity products data. To fetch the product pictures, create picture list data source as a child for opportunity products Data Source as shown below.


- Create Excel type Doc Config and upload the sample document from here. Add created Data sources in Doc Config pdf builder.

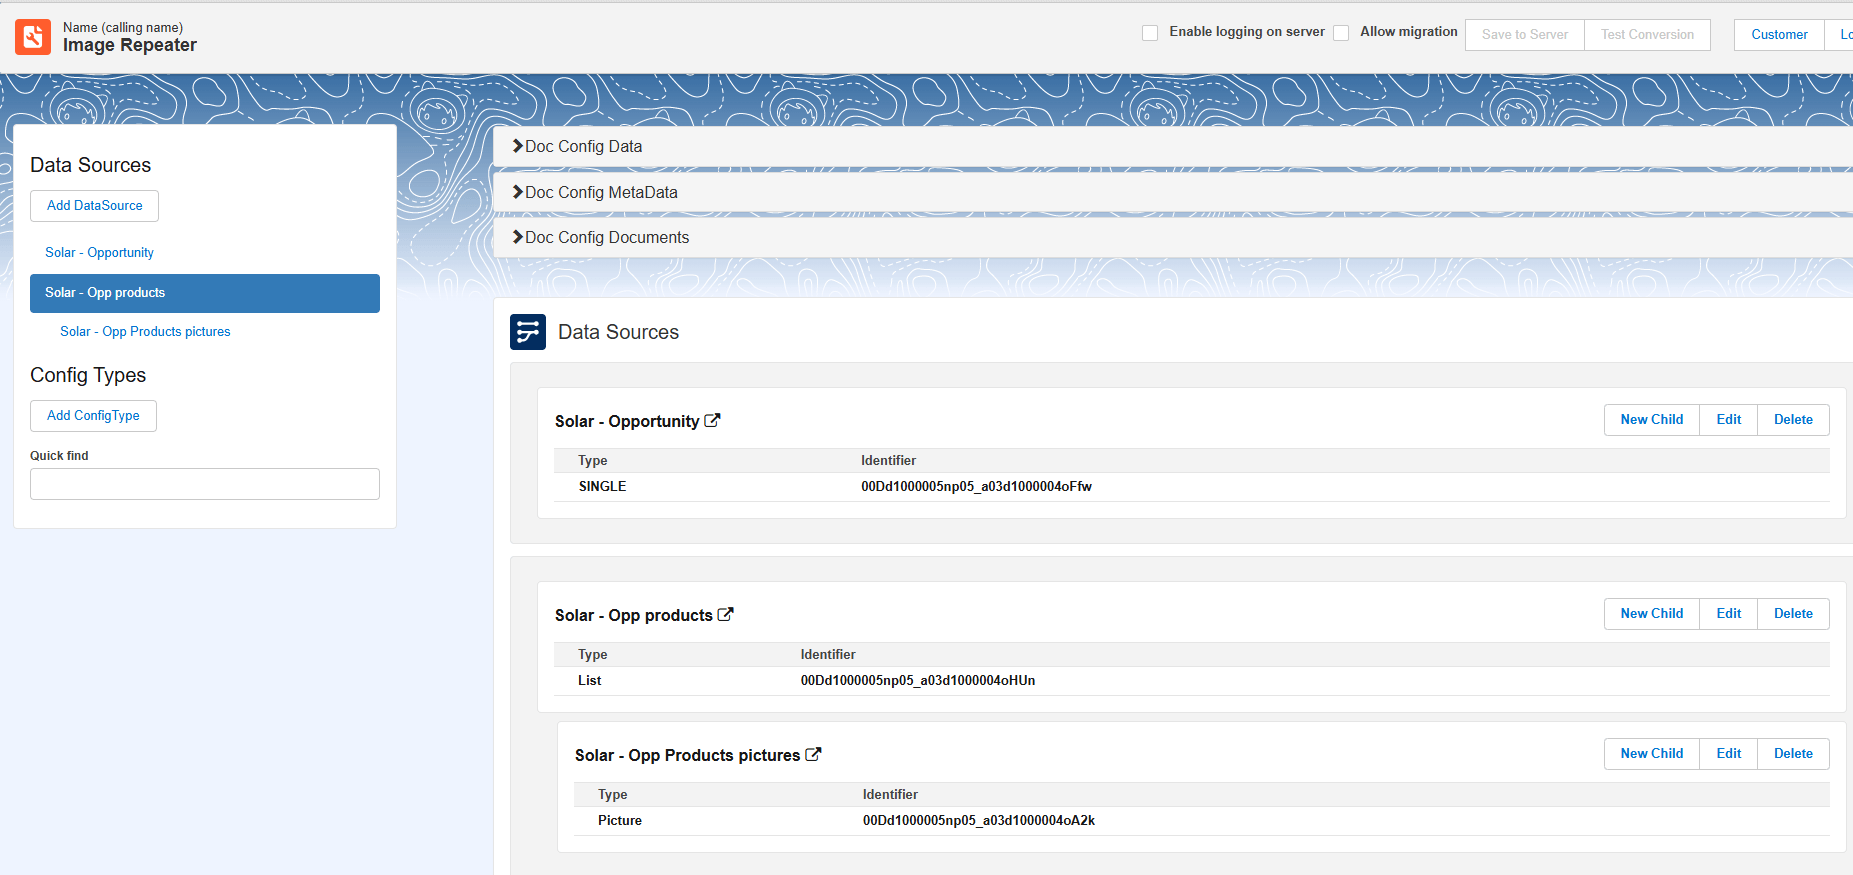
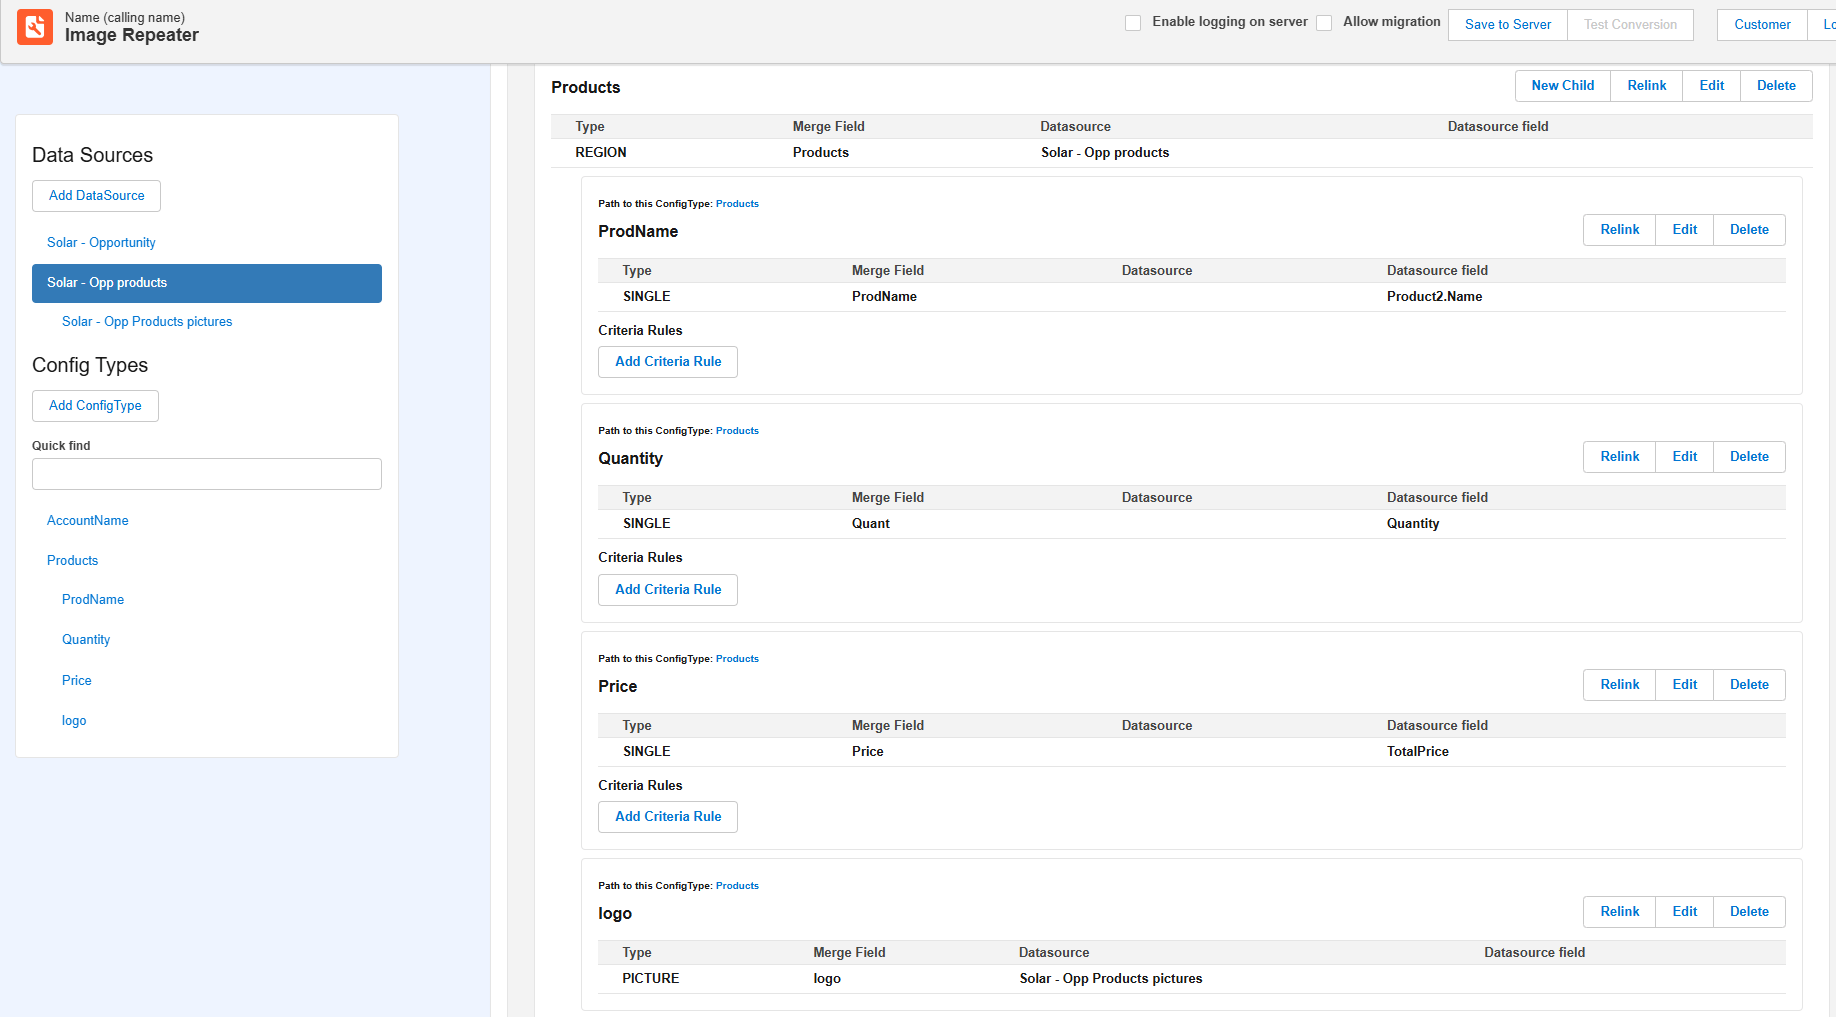
- Create Configtypes for each column in the excel file. Remember to Create Picture Configtype for picture column and map it to picture list data source as shown below.

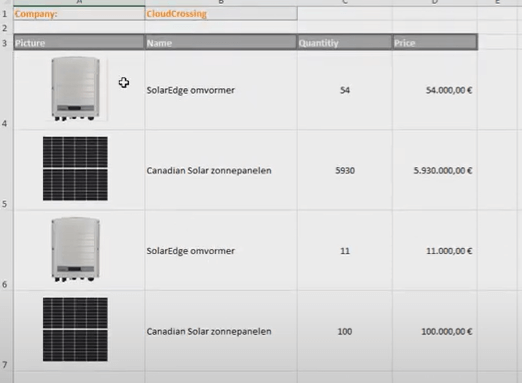
- Edit opportunity page to add the Image Repeater Doc Config id. Go to any opportunity and download the report. The report will fetch the opportunity products with Images in each row.

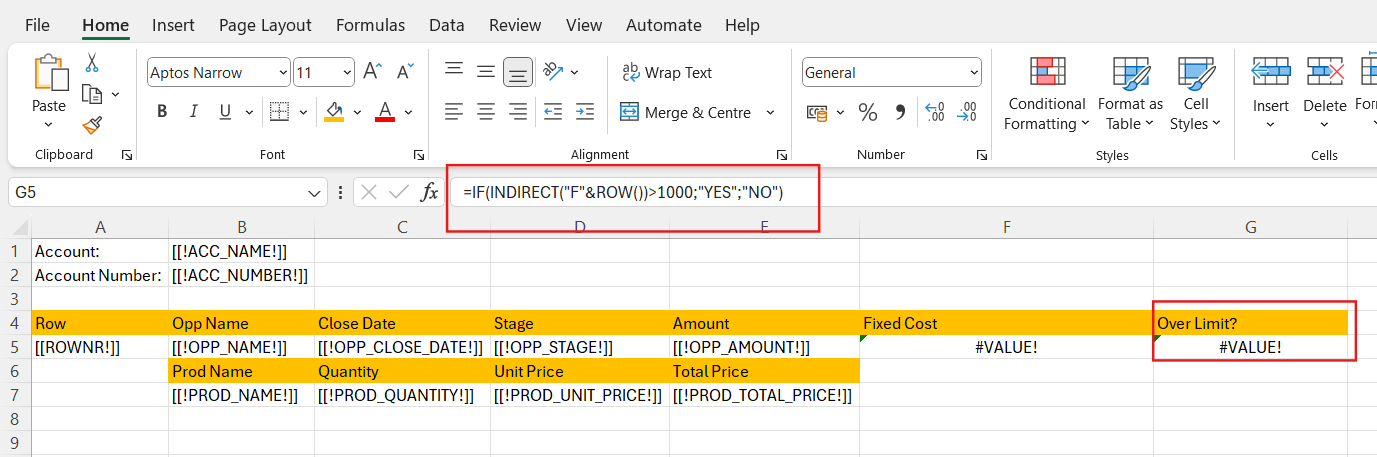
Inline functions #
Creating function in rows that are repeating by a REGION is possible by only using standard Excel functions. Use the Excel INDIRECT function to dynamically identify the row.
Examples: Above Demo explains same examples. You can download the excel file to use it in the Doc Config here. Remember to add Regions for the repeating rows in your excel file as mentioned in the starting of this topic.
As you have already learnt about how to generate excel report using PDF Butler in the starting of this topic, follow the same steps.
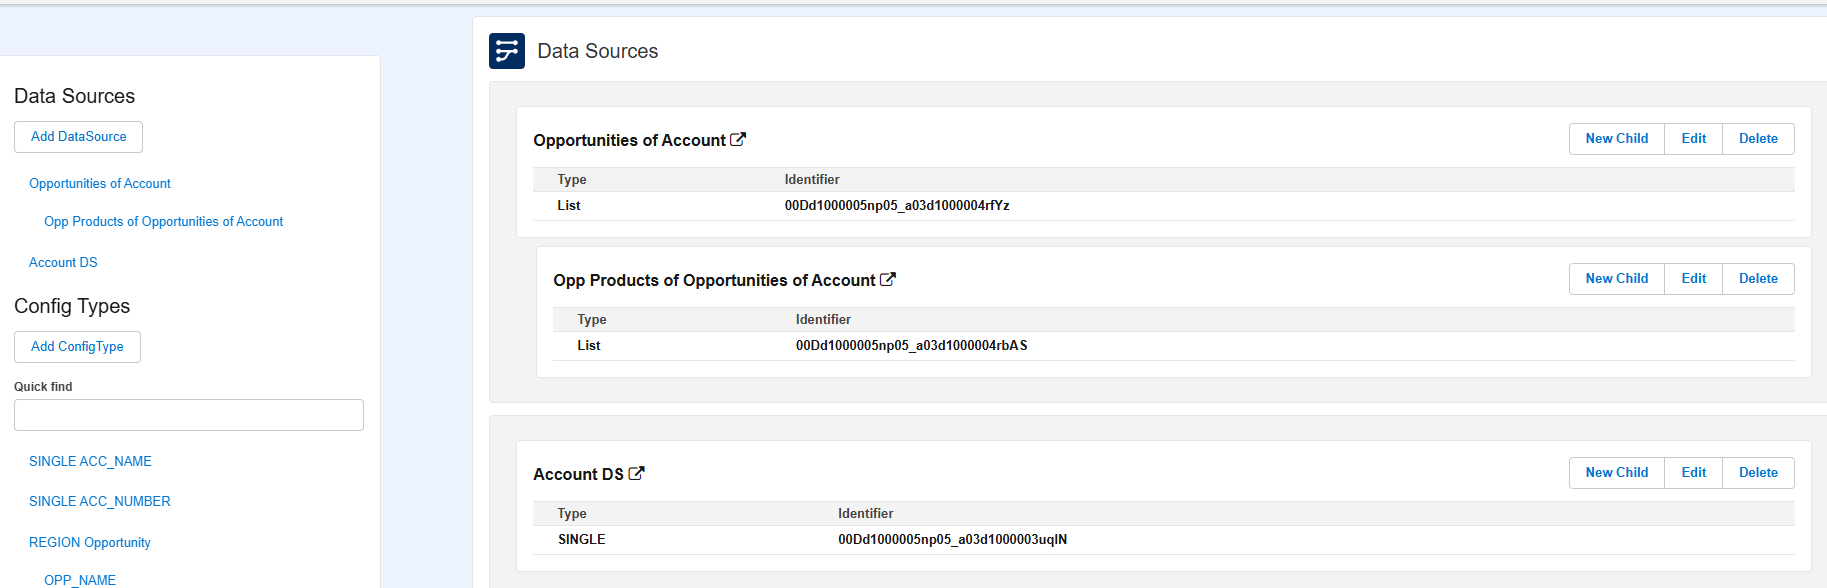
- Above Doc Config Document needs Account data, all opportunities of the account and all opportunity products of each opportunity. Create Data Sources to get all these data.
- Create a Doc Config of Main Excel Document type and upload the Doc Config Excel file. Add all the Data Sources.

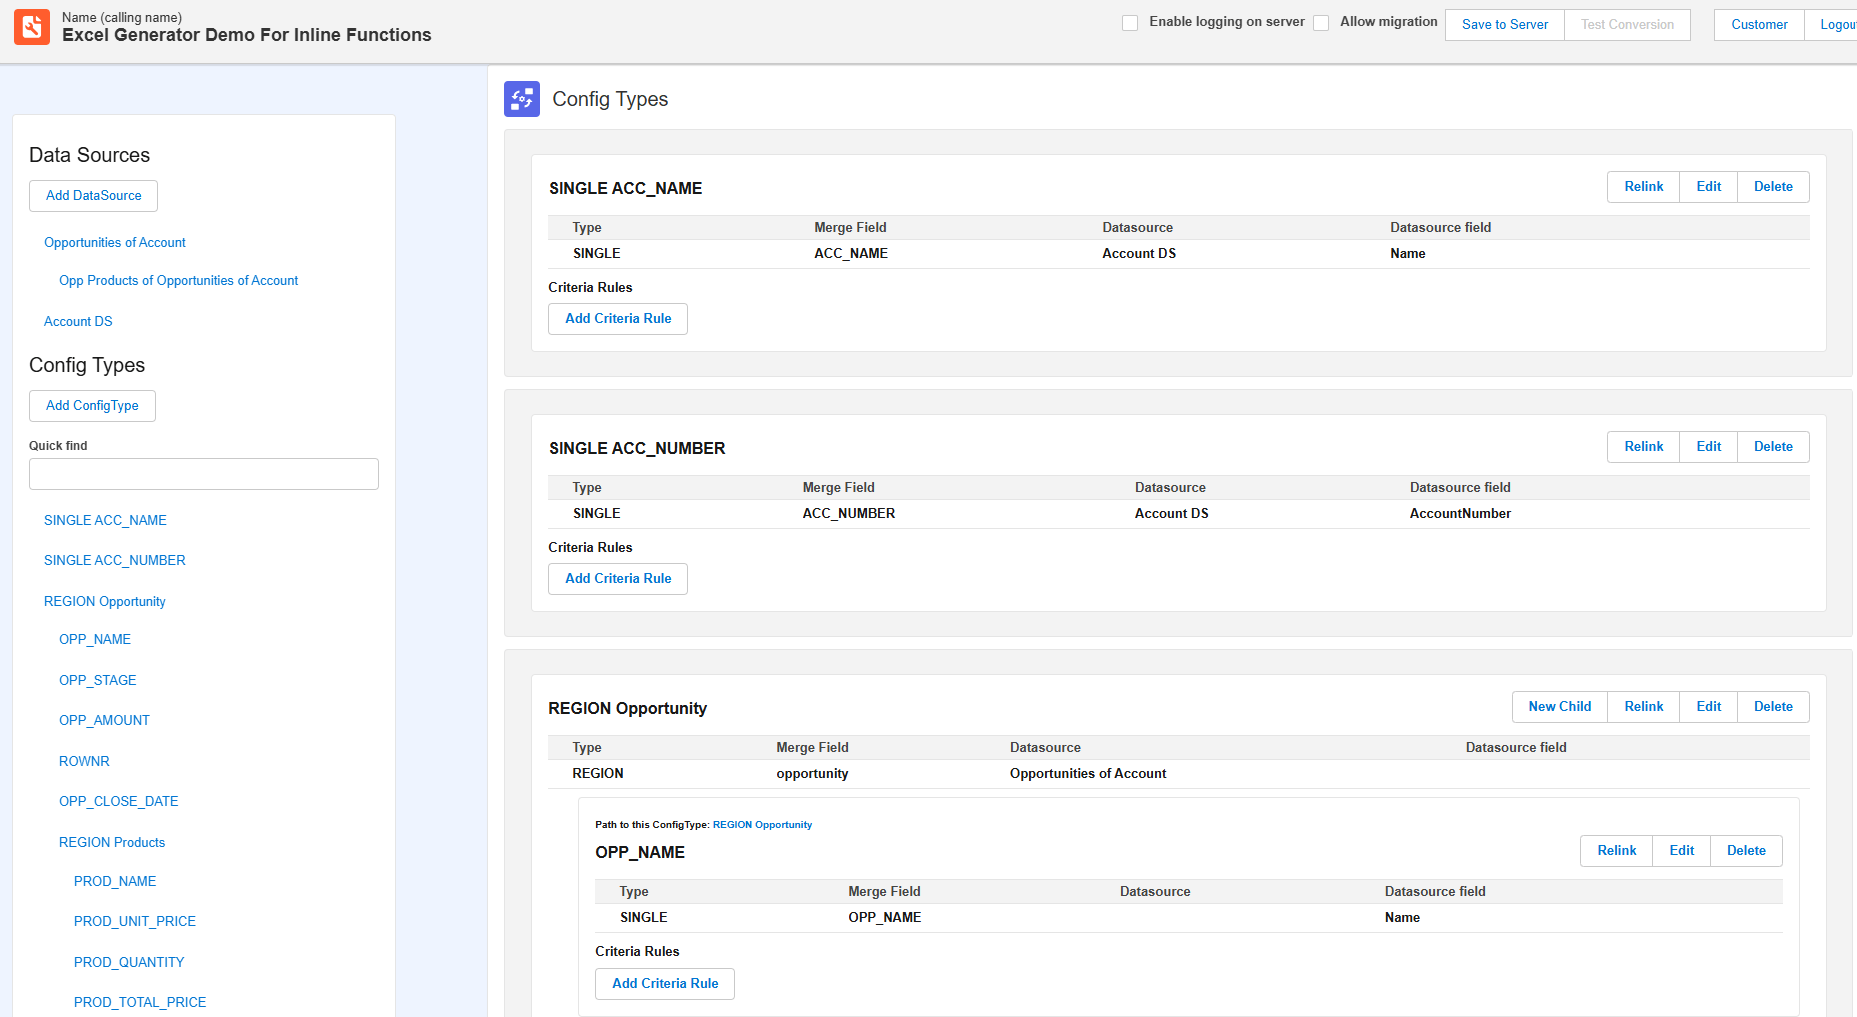
- Create correct Config type for each merge field in the Doc Config Excel file.


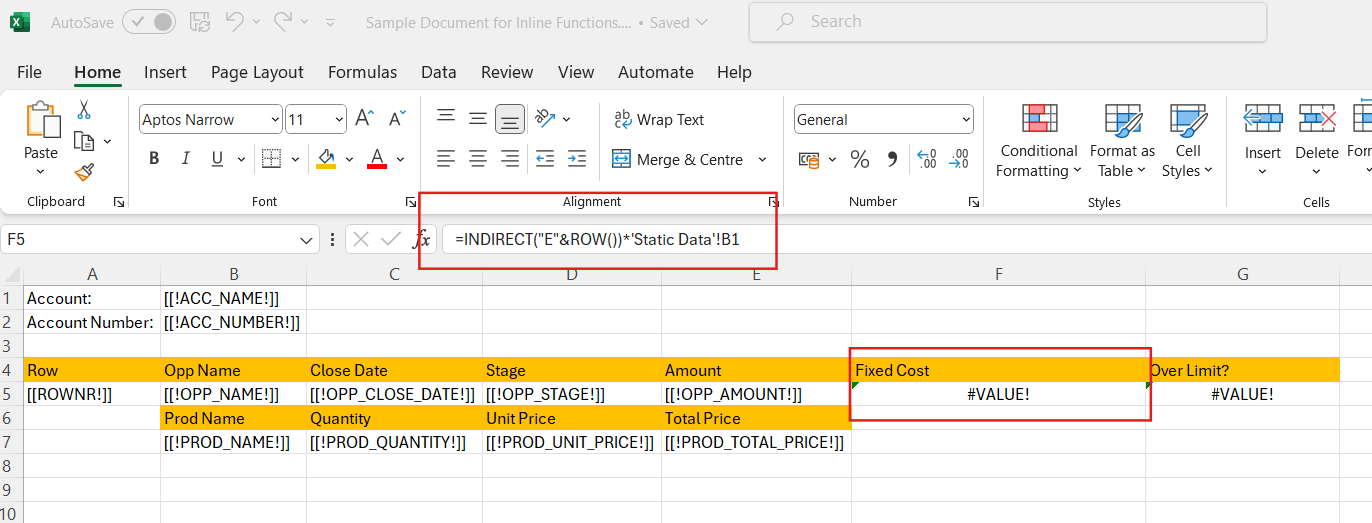
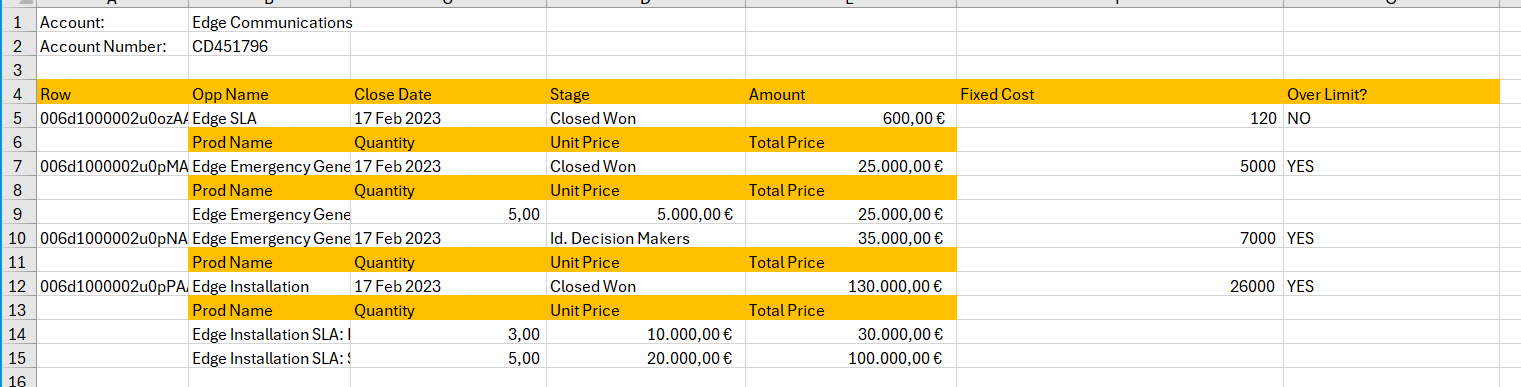
- Multiply the value in column “E” of the above Doc Config Excel file with a value in another sheet in the same excel file: =INDIRECT(“E” & ROW()) * ‘Static Data’!B1
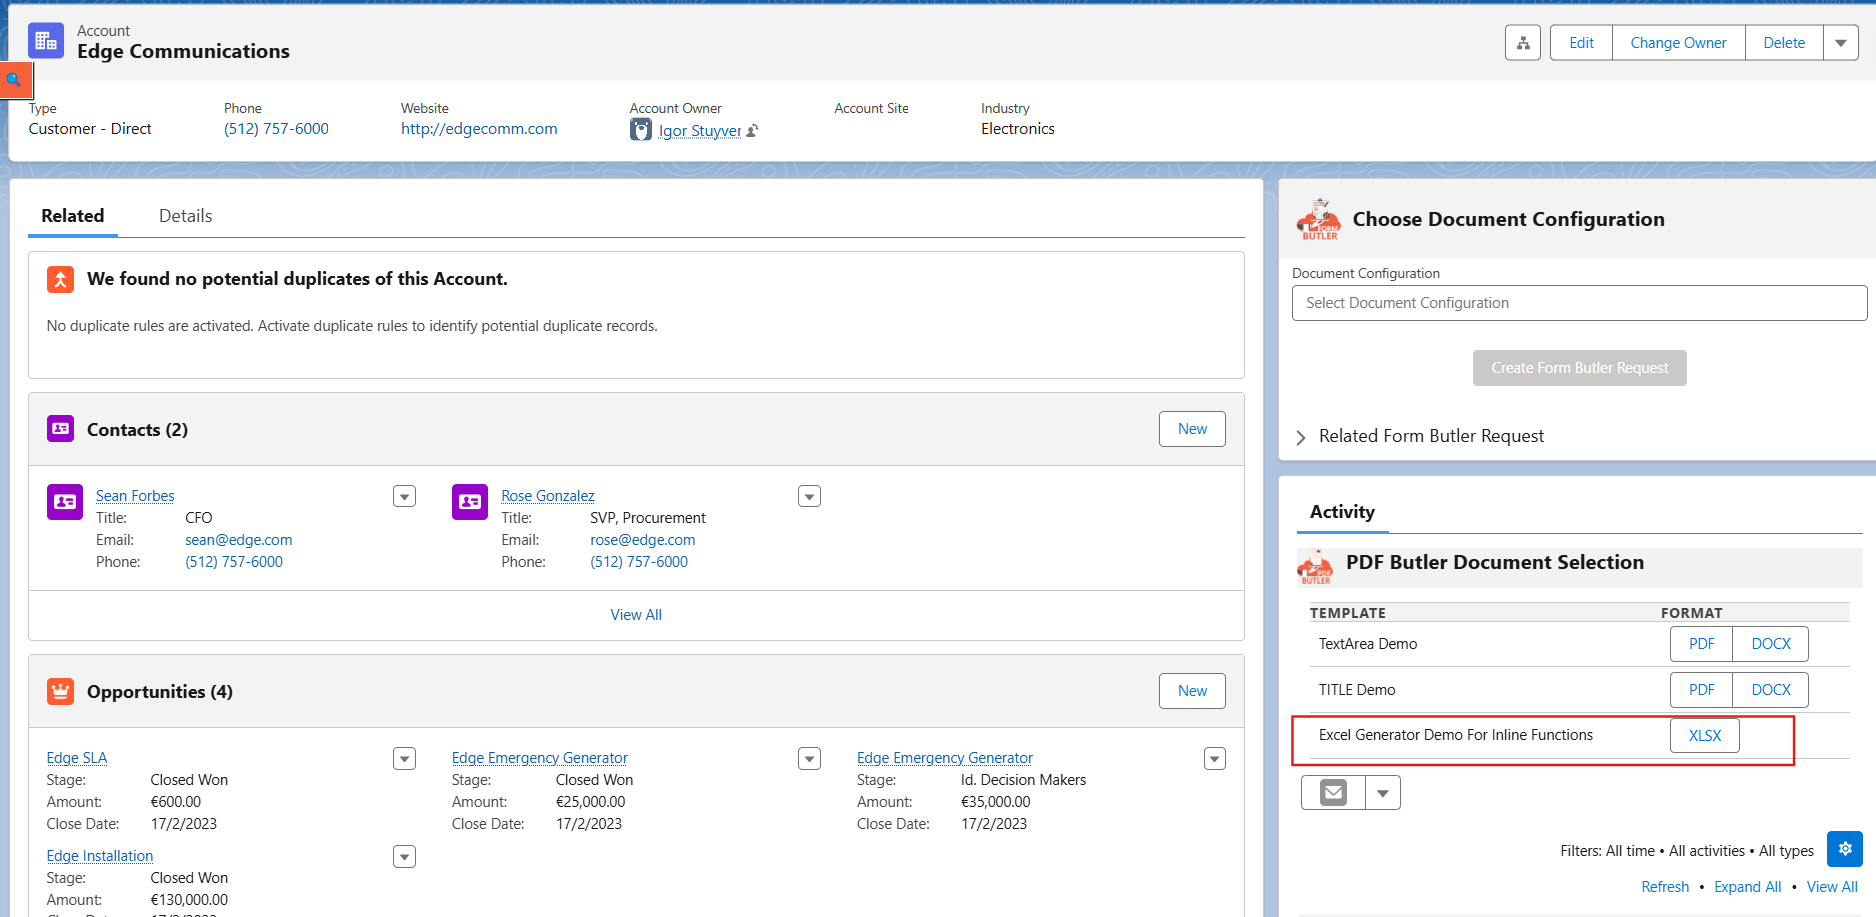
Open any Account record and add the Doc Config Id in PDF Butler convert component. Generate the excel report.


- “IF” function to compare the value in column “F”: =IF(INDIRECT(“F”&ROW())>1000;”YES”; “NO”)

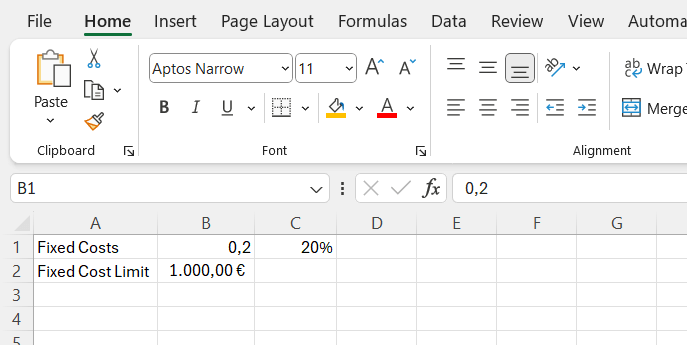
Summations/Averages/… #
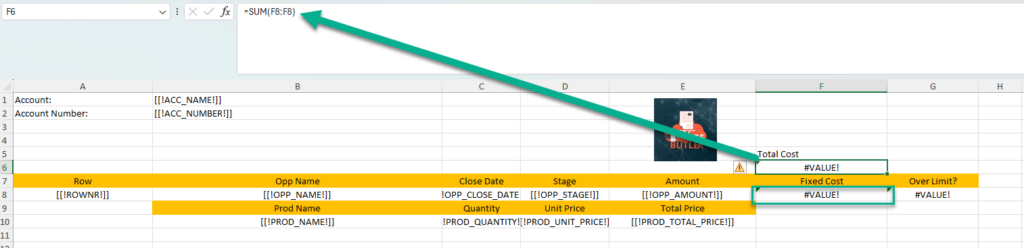
If you are repeating REGIONs, often you want a total of all values. You can just use the SUM function in Excel and specify a 1 cell region for the SUM. When generating, PDF Butler will automatically rewrite the region for the SUM.
In the example below, we want the SUM of all fixed costs when the are repeated. The template will use cell “F8” for this example. So we create a region of this cell “F8:F8”
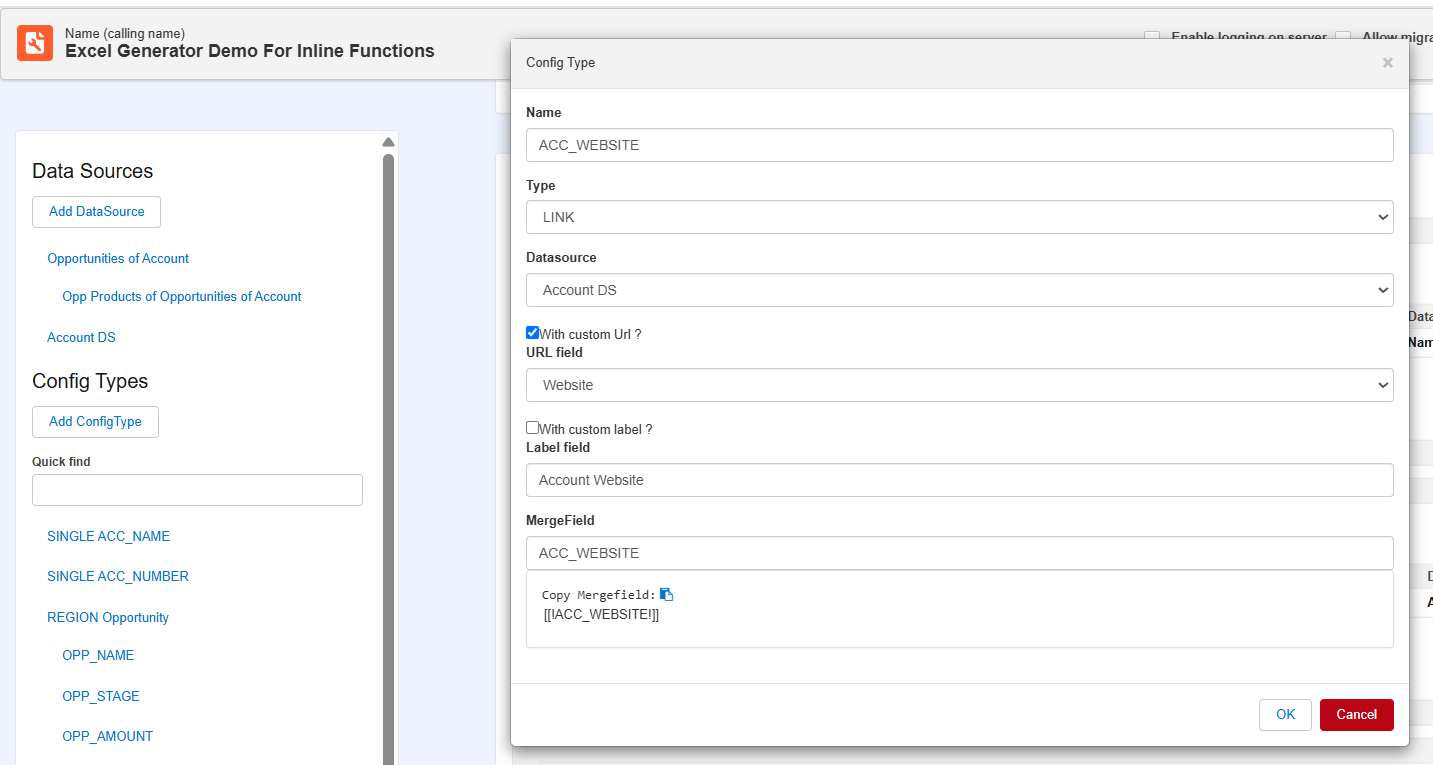
LINK ConfigType #
Add links (URL) to your Excel. This can be used from a SINGLE or from a LIST DataSource.
In the same example given for Inline functions, you can add hyperlink field and try it out. Download the template here.
RICH_TEXT ConfigType #
Excel support a downgraded version of Rich Text. So we cannot support all features but only what Excel allows. This can be used from a SINGLE or from a LIST DataSource.
Checkbox #
You can add checkboxes to your excel and add logic to calculate checkbox value using ‘Checkbox’ Config type. Create an xlsx file as shown below and insert checkboxes with merge fields.


Example:
Let’s show below merge fields in Excel using Account Object. These are some of the examples that are explained in article. You can add any logic according to your requirements.
Acc: [[!AccountName!]] – Account Name to show in Excel
Has notes? [[!HasNotes!]] – If Account has Note Records, then this checkbox will be set to true
Has Website? [[!HasWebsite!]] – If Account has a website, then this checkbox will be set to true
Is Burlington? [[!IsBurlington!]] – If Account Name Contains ‘Burlington’, then this checkbox will be set to true
Name has A? [[!Name_A!]] – If Account starts with ‘A’, then this checkbox will be set to true
- Go to Insert tab and Insert checkbox form control in to the cell and give some merge field name to it.
- Create Doc Config of Type Main Excel Document.

- Create Data Sources as shown below.


- Open PDF Butler configuration page and upload the xlsx template under Doconfig Documents. Create Config types as shown below


- Add Doc Config to the Account record and Generate excel.


Note #
- You cannot use multiple merge fields in a single cell of your excel template. Only use one merge field per cell.
- PDF Butler provides an ability to generate your excel file as PDF. You can contact support team to enable this feature. Once license is enabled, below setting should be given in convert component to generate in PDF.