If you would like to insert a chart in your document, this article explains step by step process to do it. Before proceeding with the steps to insert a chart into your document, ensure you complete the following prerequisites to use this feature.
QuickChart is the opensource code which is used to develop these. Once you install the package, you can see the apex class which is using this open source code to display the charts.
Prerequisites #
- Install package: Paste below URL to your org URL and install the package
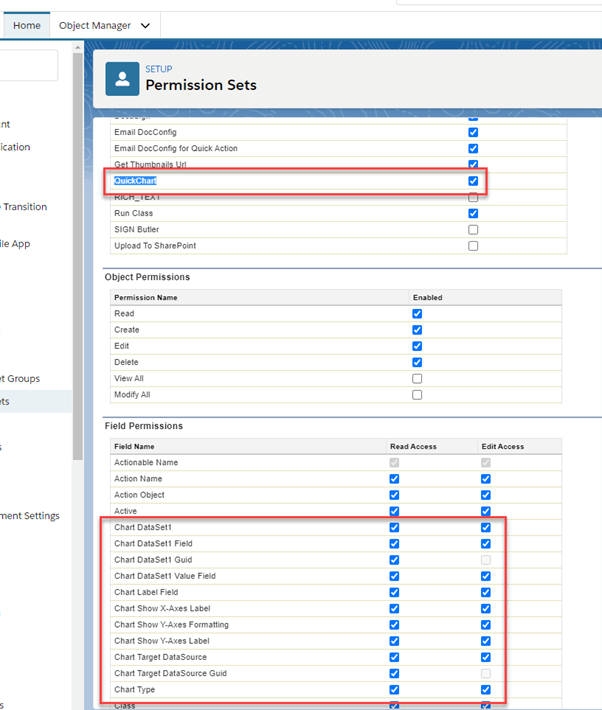
/packaging/installPackage.apexp?p0=04t3X000002xTjk - Setup below permissions in the PDF Butler Admin Local Permission set which was created during PDF Butler installation.

Example #
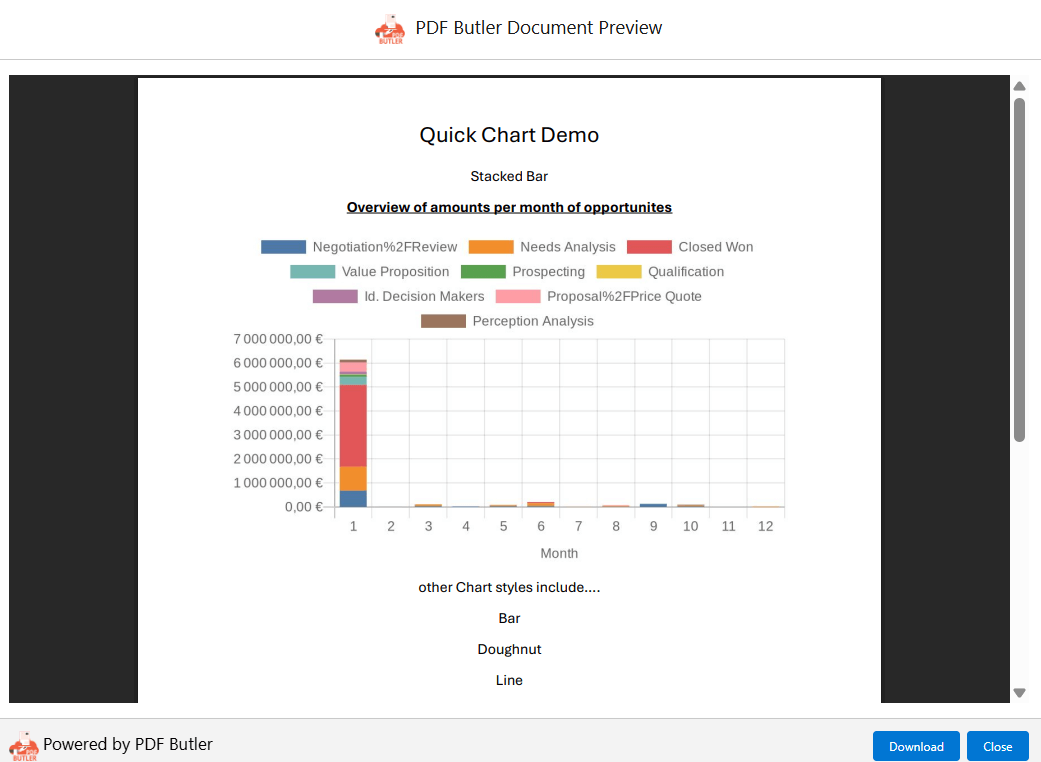
Let’s say, you want to show the overview of the amounts per month of the opportunities. You can do this by following below steps.
Doc Config Document Template #
Download the Doc Config Document Template here and this document will have a picture placeholder which will act as a container for the Chart. This picture placeholder can be downloaded from here and a merge field should be mapped to this picture placeholder in the document.
Data Sources #
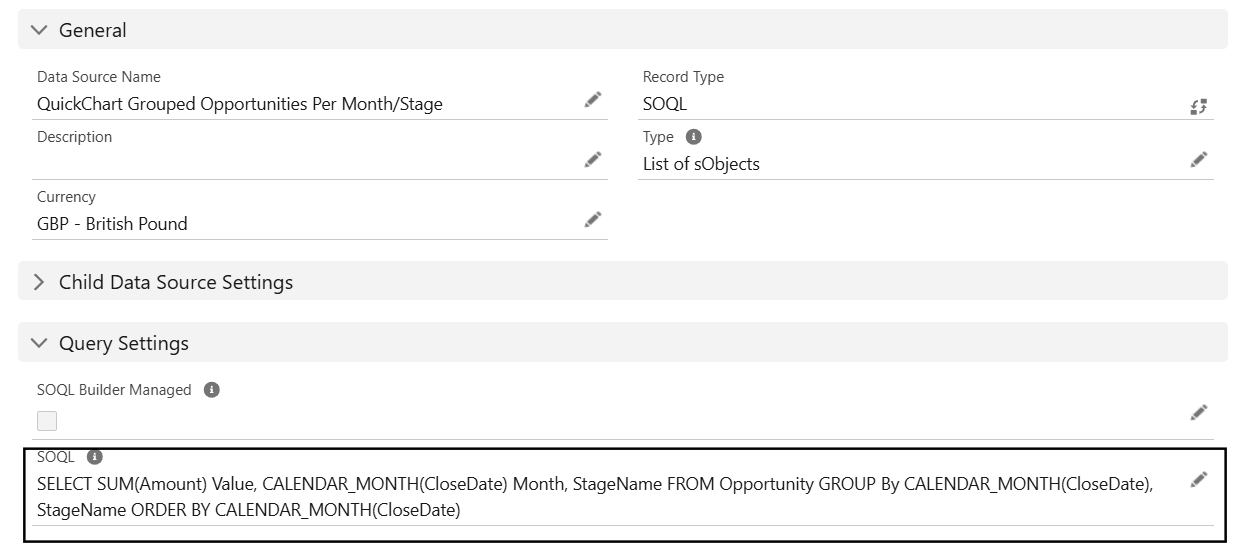
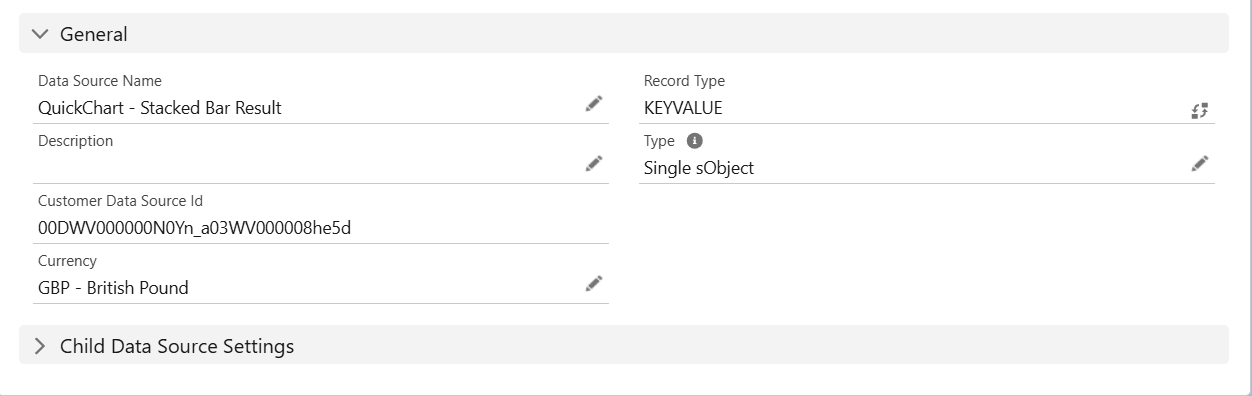
Create two Data Sources as shown below
1) SOQL Data Source which will fetch the opportunities
2) KEYVALUE Data Source of type Single sObject
Doc Config #
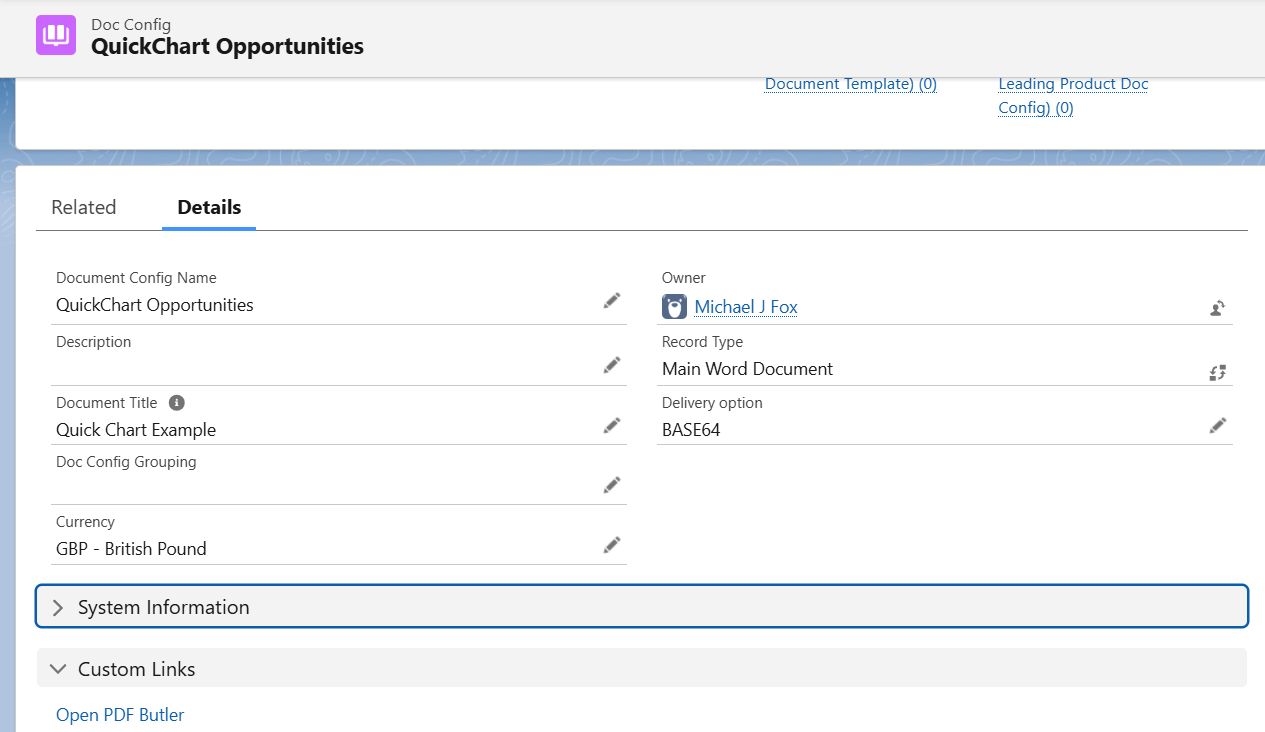
Create a main word document Doc Config of BASE64 Type.
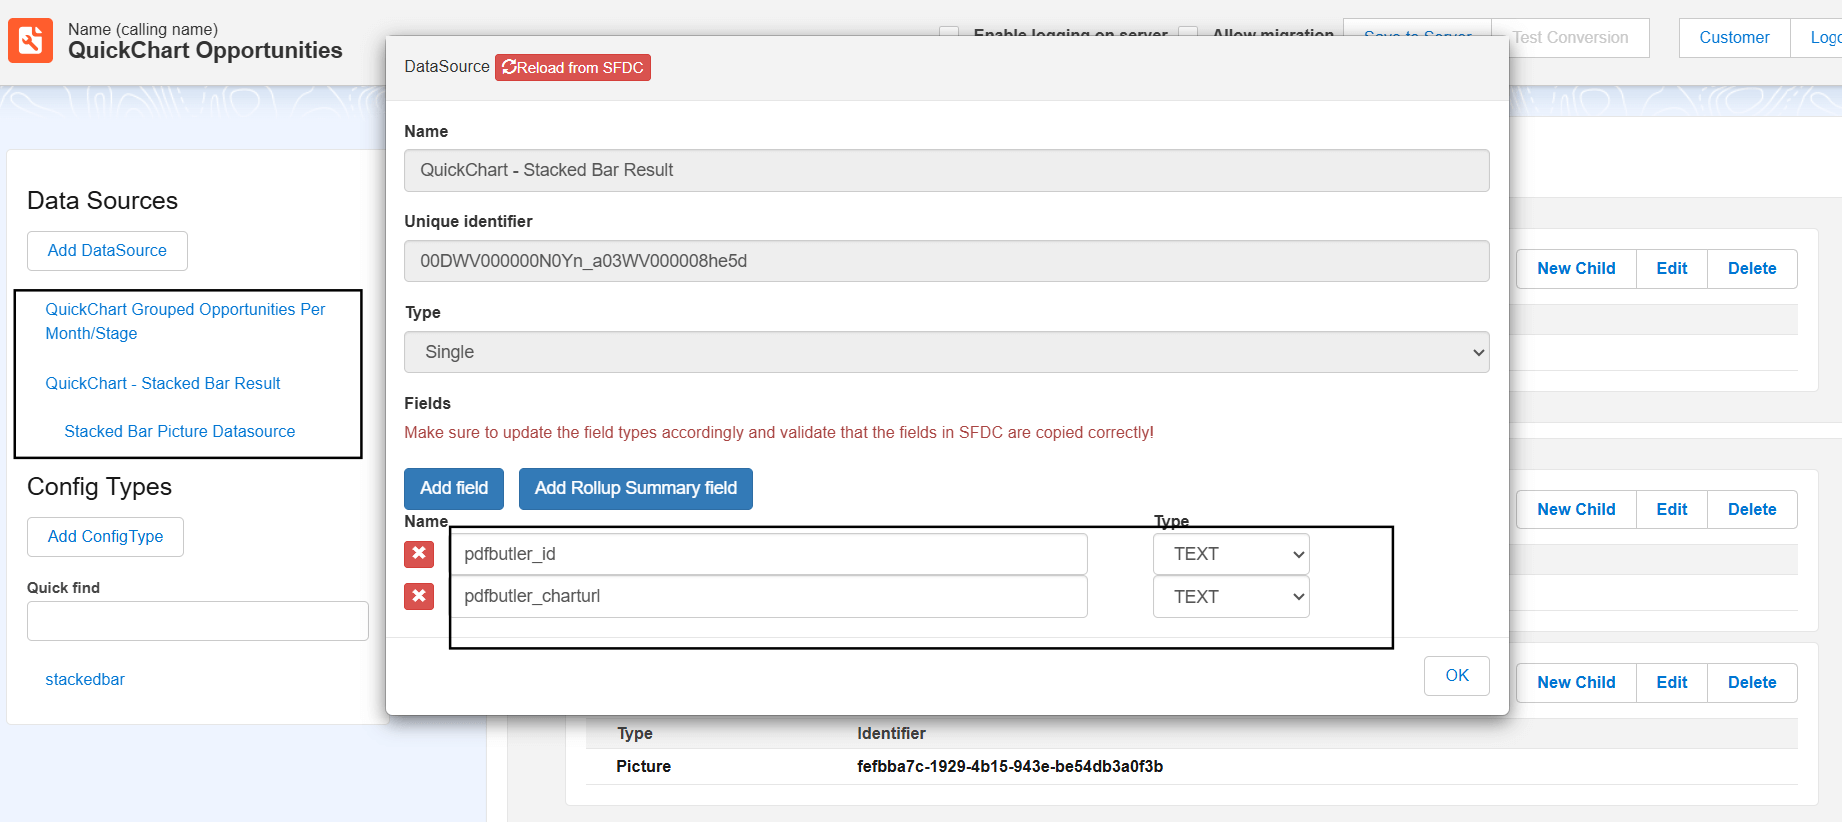
Add the two Data Sources to the Doc Config by opening PDF Butler from Doc Config and Edit the KeyValue Data Source, then add the fields “pdfbutler_id” and “pdfbutler_charturl”.
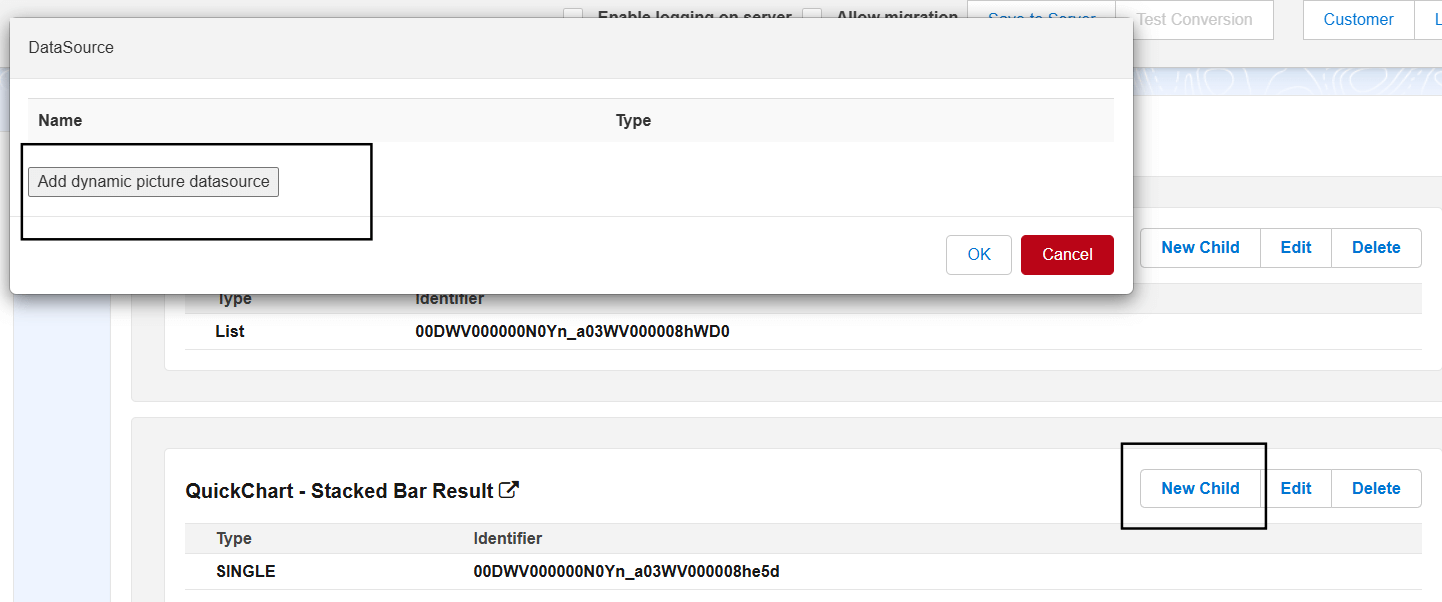
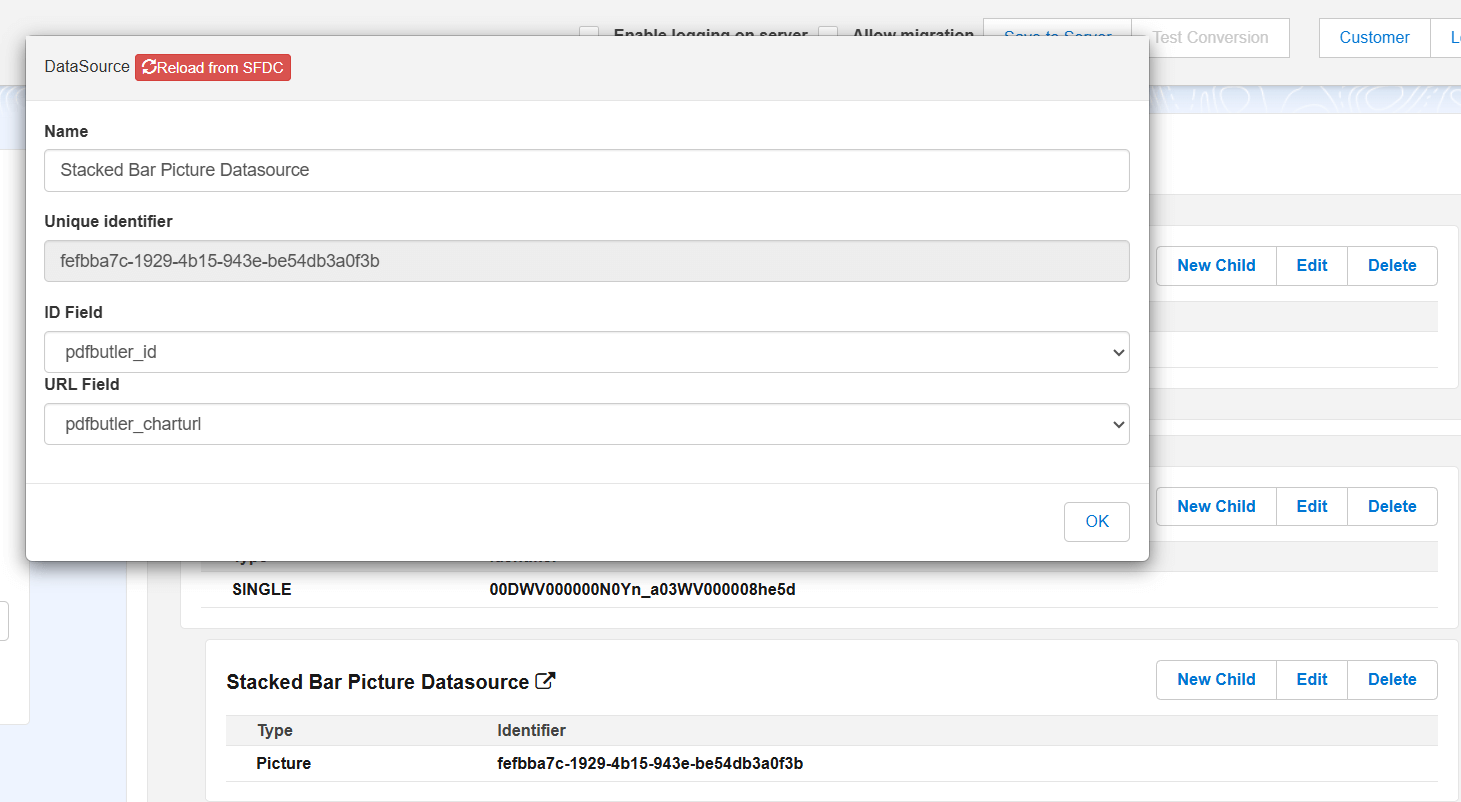
Under the KeyValue Data Source add a child Data Source as shown below and Map Id , URL fields to the above fields.
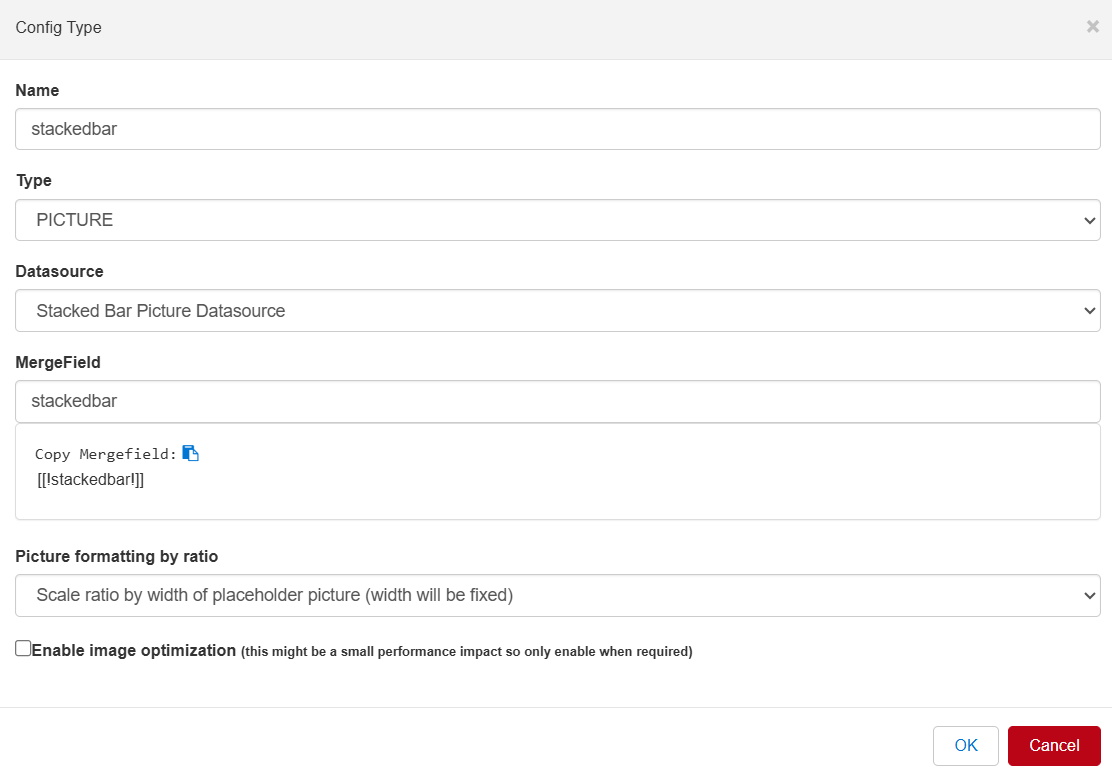
Create a Picture Config type for the Placeholder in the document.
Actionable record #
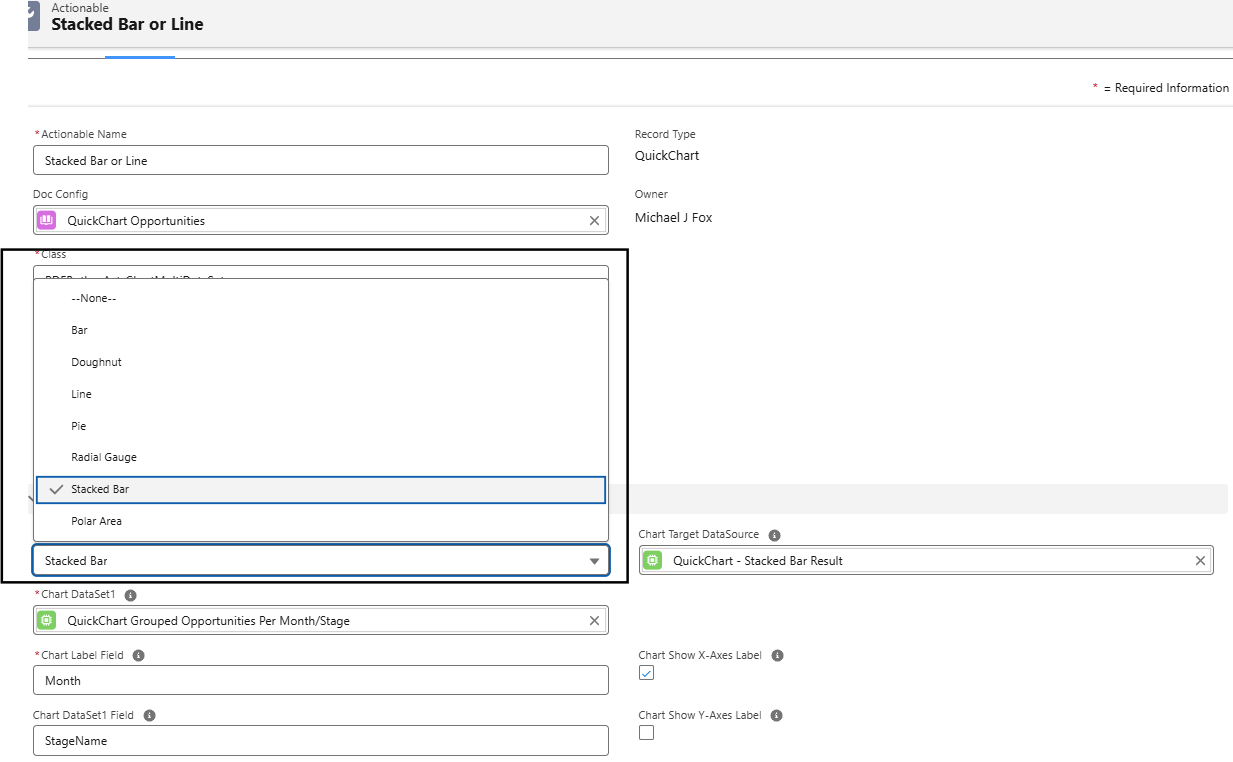
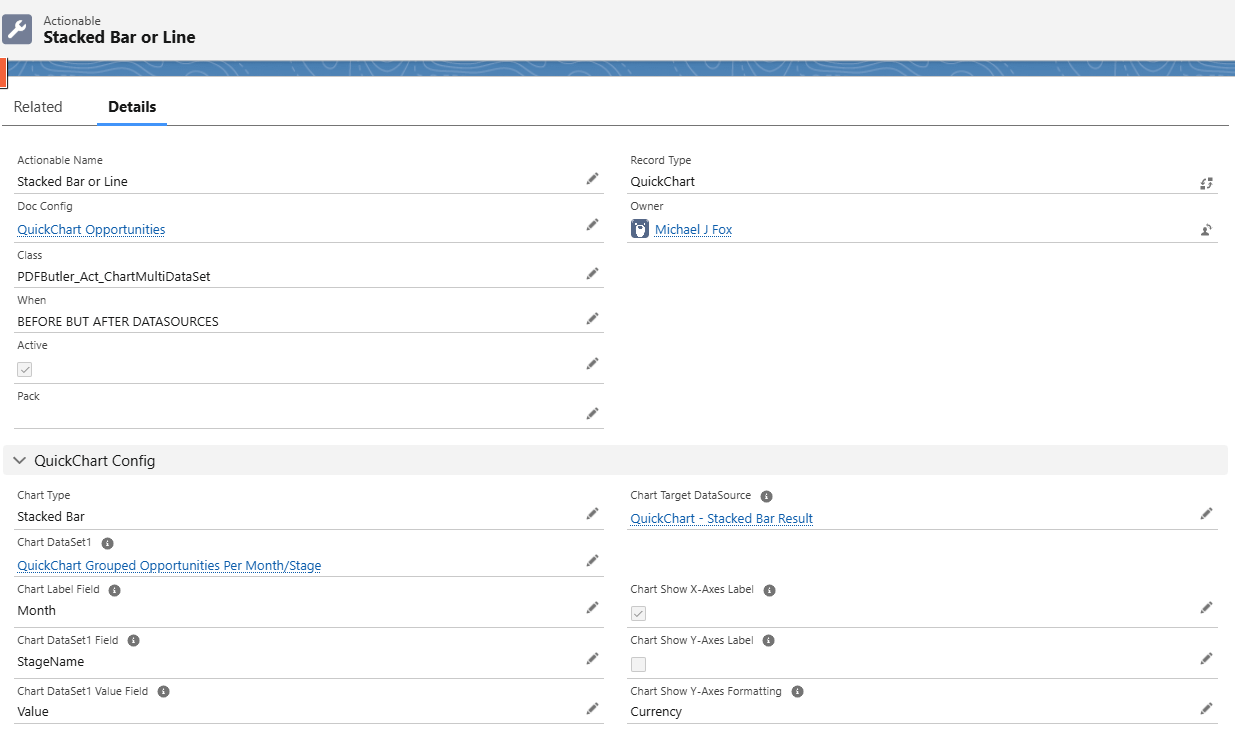
Create an Actionable record of type ‘Quick Chart’ to the above Doc Config as shown below.
- Actionable class – PDFButler_Act_ChartMultiDataSet
- Chart type – Choose this according to your requirement and in this example, it is Stacked Bar.

- Chart DataSet1 – The PDF Butler DataSource that selects the data required to create the chart
- Chart Target Data Source – The PDF Butler DataSource that will receive the URL for the chart. This DataSource will get 2 extra fields by the Actionable: “pdfbutler_id” and “pdfbutler_charturl”
- Chart Label field – the field API name that has the labels for the chart, in most cases for the X-axis
- Chart DataSet1 Field – The field API name of the label for the DataSet. Leave this field empty for Pie, Doughnut, Polar Area, Radial Gauge
- Chart DataSet1 Value Field – The field API Name that has the datapoints or values for the chart
- Chart Show X-Axes Label – The name of the label field on the X-Axis (if Cartesian chart)
- Chart Show Y-Axes Label – The name of the label field on the y-Axis (if Cartesian chart)

Testing #
Add the Doc Config to the Account page and generate the document with the stacked chart.